

 12
12
Analysts and traders continue to assess whether the recent $XRP price crash finally marked the token’s bottom, anticipating a reversal.
$XRP recently recorded its biggest decline of the year as the broader crypto market came under new selling pressure. On June 6, the token dropped to a new yearly low of $1.05 before recovering slightly. At the time of analysis, $XRP was trading around $1.11.
The massive decline has led to renewed discussions among market observers about whether $XRP had finally reached its bottom in the months-long correction.
Key Levels That Could Decide $XRP’s Next Move
In a recent analysis, market commentator Casi noted that $XRP had found support at the major 0.786 macro retracement level around $1.09 before bouncing higher. After the rebound, the token moved up to a local 0.382 retracement level, which she identified as point A. This sits around $1.17.
Casi believes $XRP is now finishing what appears to be a Wave B correction. She noted that the target for this B wave sits at the 0.5 retracement level near $1.12, a level that $XRP has managed to hold so far.
She noted that if the current rebound develops into a standard ABC corrective pattern, $XRP should remain above the $1.12 area and gradually move toward the next resistance level at $1.25.
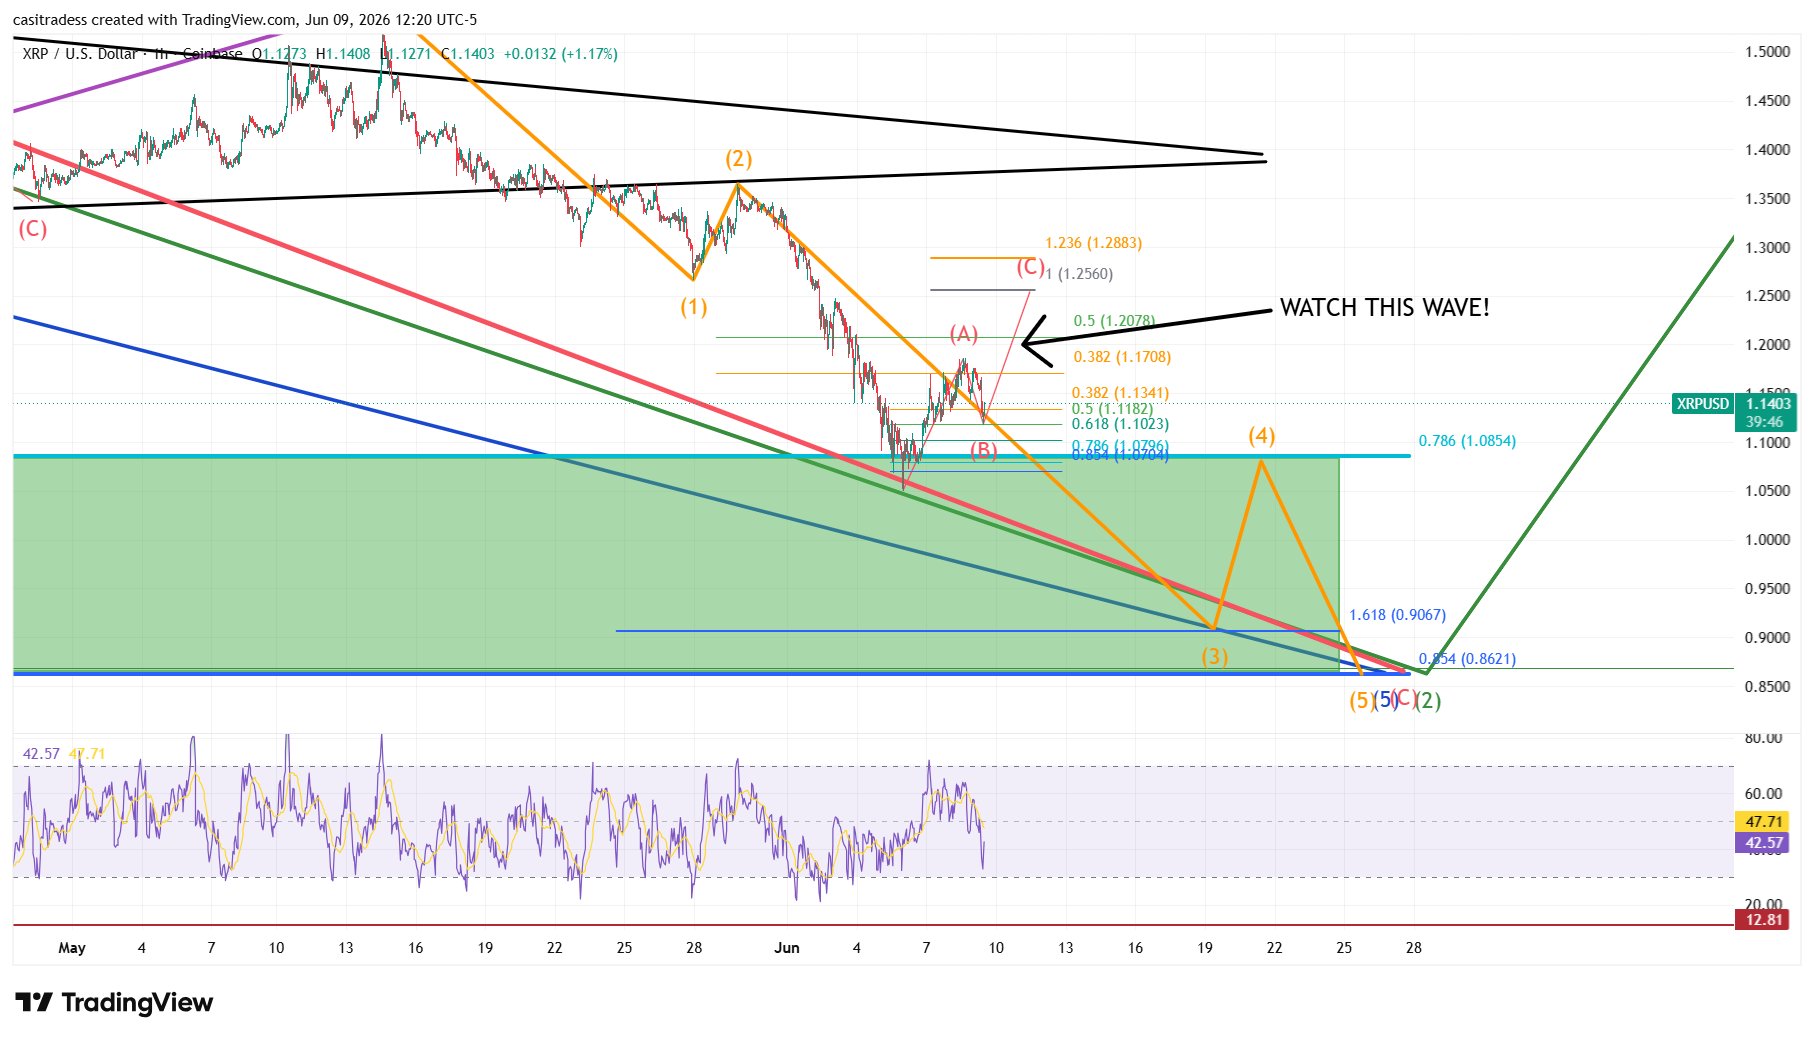
According to her, the $1.25 zone is especially important because it marks the upper range of where the current Wave 4 relief rally could extend while still allowing for a final Wave 5 decline. In this scenario, $XRP could eventually fall toward the $0.90 support area before completing the larger correction.
Bullish and Bearish Outcomes for $XRP
Casi said the market’s behavior over the coming days could provide clearer direction. In her bullish scenario, $XRP continues holding above $1.12, breaks through nearby resistance levels, and gains enough momentum to push higher.
According to her, a move above $1.30 is a major sign of strength. She noted that a rally toward $1.65 would significantly reduce the likelihood of another drop to the $0.90 region, making a final Wave 5 decline far less necessary.
However, the analyst also shared a bearish possibility. In this case, $XRP would rise toward the $1.25 resistance area but fail to break above it. If sellers step in at that level, the token could reverse course and fall below the 0.786 support level at $1.09.
Should that happen, Casi believes $XRP could continue lower toward the $0.90 zone, completing what she described as the broader macro Wave 2 correction.
For now, she advises traders to watch how $XRP reacts around the $1.12 support level and the $1.25 resistance level over the next one to two days. According to her, the price action around those areas should help determine whether the market has already formed a bottom or if one final downward move still lies ahead.
One More Low May Still Be Ahead
Meanwhile, Tara, another analyst, pointed out that $XRP has already reached its target resistance level around $1.17. However, she noted that Bitcoin has yet to reach its own target.
According to Tara, Bitcoin’s next move could still influence $XRP in the short term. She suggested that if Bitcoin climbs toward the $66,300 level, $XRP could see additional upward movement and potentially reach the $1.20 resistance area.
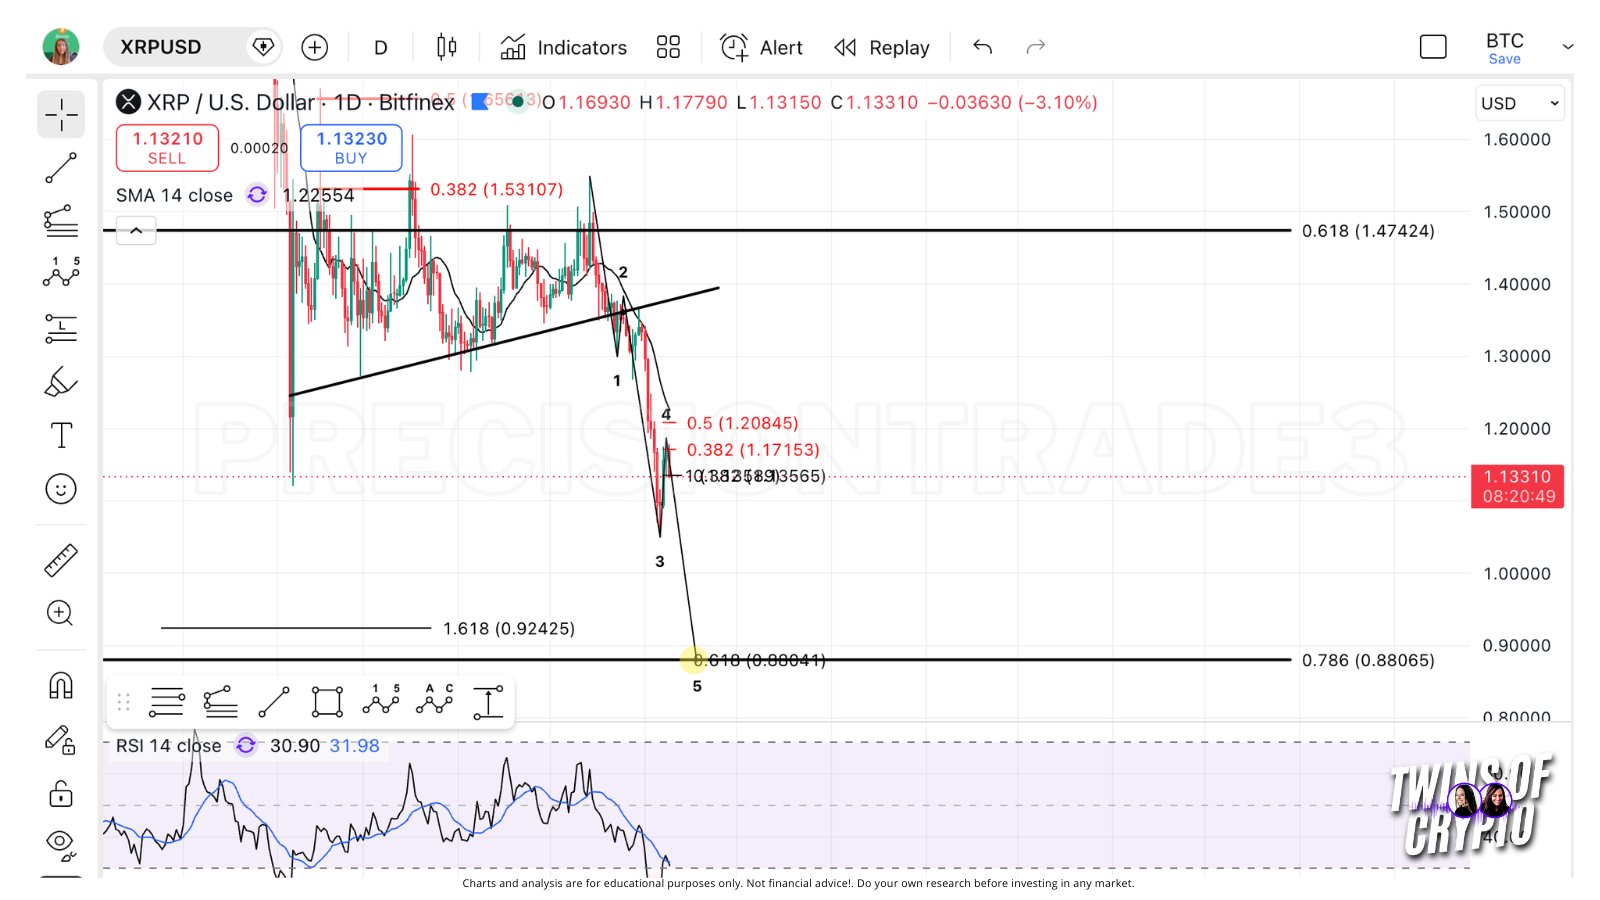
Despite this possibility, Tara warned that traders should pay close attention to whether $XRP can move above $1.17 during the current rebound. If the token fails to set a new high above that level, the projected Wave 5 target could remain in play.
In this scenario, Tara noted that the Wave 5 0.618 extension aligns closely with the broader 0.786 macro support level at $0.88. As a result, she believes $XRP could still make one more move lower before the current correction fully ends, suggesting that the final bottom may not yet be in place.

