



 11
11
$OKB extended its powerful rally this week after buyers triggered a major breakout above key resistance levels. The token gained more than 16% in the past 24 hours and nearly 19% over the last seven days. Trading activity also accelerated sharply, with daily volume climbing above $117 million.
The latest move pushed $OKB near the $97 level and strengthened bullish sentiment across the broader market. Besides, traders now watch whether the token can secure a decisive breakout above the psychological $100 barrier. Strong technical indicators and improving exchange flow activity continue supporting the bullish structure.
$OKB Breakout Signals Strong Trend Reversal
$OKB’s daily chart shows aggressive buying momentum after the token surged beyond the long-standing $82.80 resistance zone. The breakout confirmed a major shift in market structure after months of consolidation and weaker price action. Consequently, buyers regained control as the token moved above all major exponential moving averages.
The 200-day EMA near $93.96 now acts as an important support level for the ongoing trend. Moreover, $OKB also climbed above the 0.786 Fibonacci retracement level at $94.33, strengthening bullish continuation signals. Technical momentum indicators continue flashing positive signals as volatility expands.
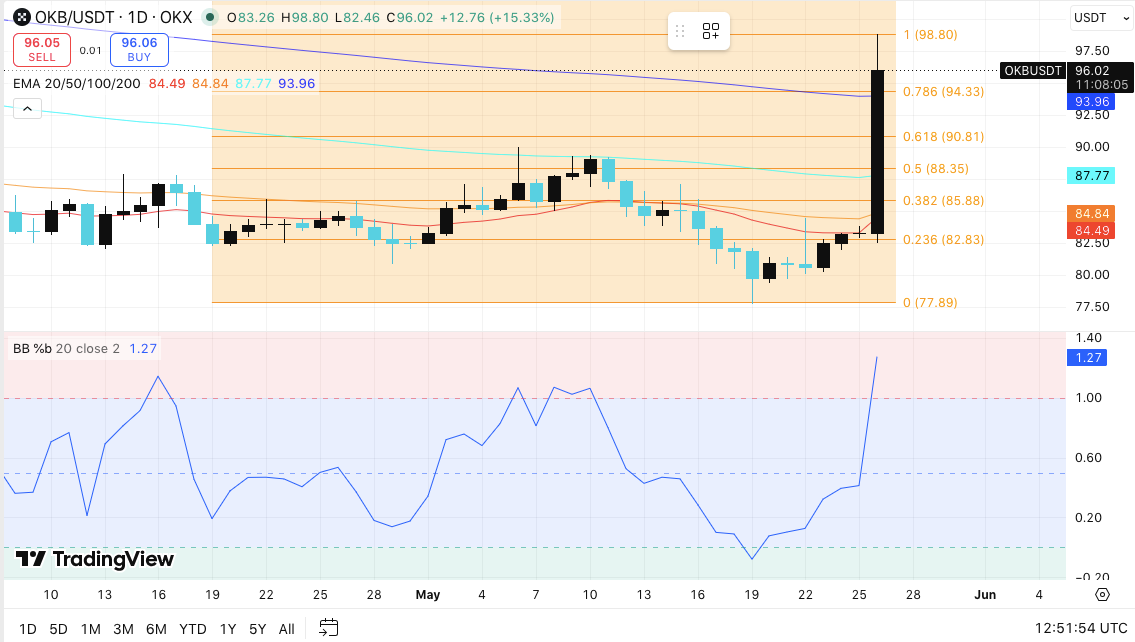
Bullish pressure remains strong while the Bull Bear Power indicator stays above 1.20. This reading usually reflects aggressive buyer participation and strong trend acceleration.
Hence, traders now focus on the next resistance near $98.80. A daily close above this level could quickly open the door toward the $100 psychological region.
However, short-term pullbacks remain possible after such a rapid rally. Immediate support sits near $94.33, followed by $90.81 and $88.35. If sellers increase pressure, the broader demand zone between $84.80 and $82.80 may attract fresh buying interest.
Open Interest Activity Reflects Cautious Optimism
$OKB derivatives data reveals changing trader behavior over recent months. Open interest expanded aggressively during August and September as speculative activity surged alongside price growth. During that period, leveraged positions climbed toward the $100 million region while $OKB traded above $200.
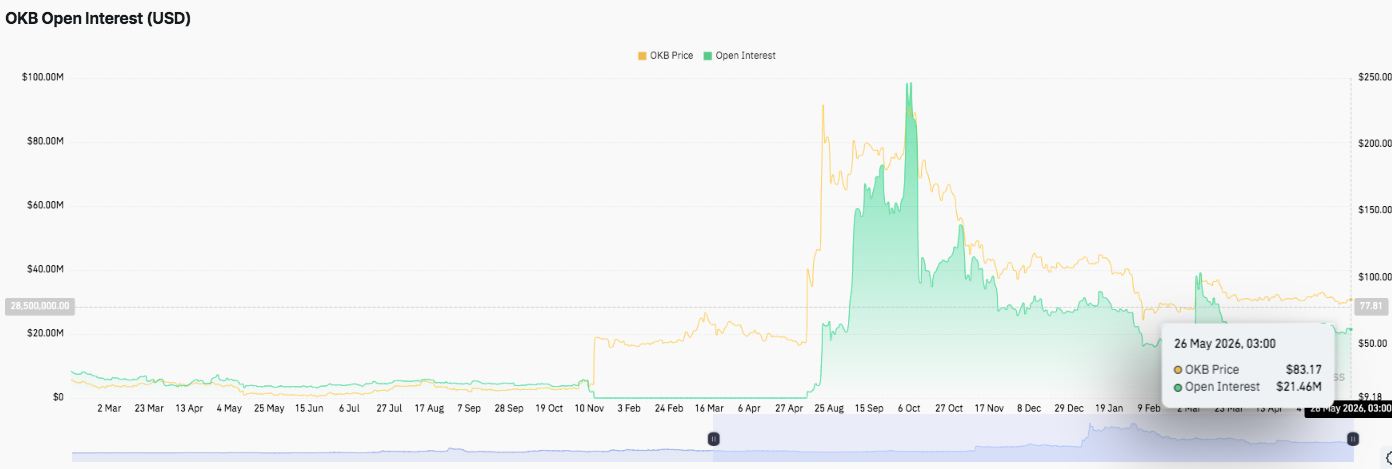
However, the market later entered a correction phase, causing traders to reduce exposure heavily. Open interest declined sharply after the peak and stabilized between $20 million and $40 million since November. Additionally, the latest reading near $21.46 million suggests traders still remain cautious despite the recent rally.
This relatively low derivatives activity may reduce liquidation risks while allowing spot demand to drive the market higher.
Exchange Flows Show Renewed Buying Interest
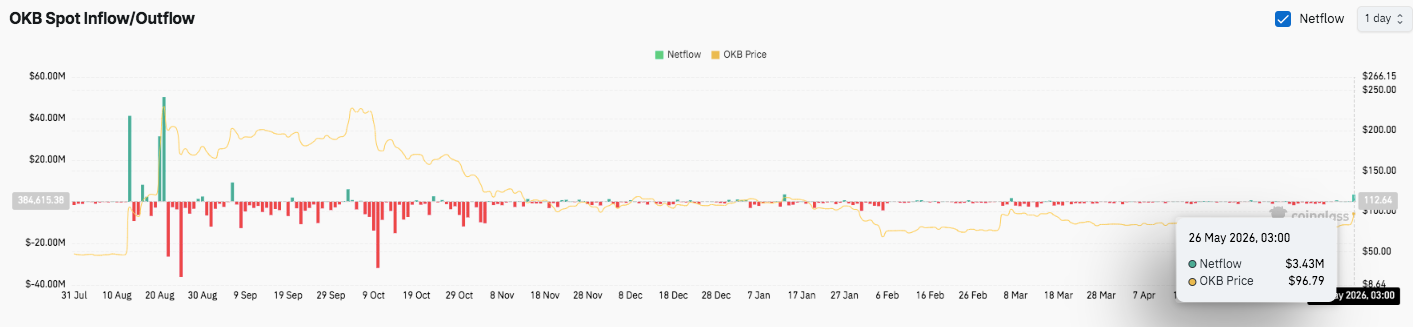
Spot inflow and outflow data also highlights improving market sentiment. Large inflows and outflows dominated trading activity during August and October, reflecting intense volatility and speculative positioning. Significant positive netflow spikes suggested aggressive accumulation phases, while deep negative flows pointed toward heavy profit-taking.
Since November, exchange activity has gradually stabilized. Smaller inflow and outflow swings now indicate calmer market conditions and balanced positioning. Moreover, the latest positive netflow spike near $3.4 million suggests fresh buying interest may return to $OKB markets.
Technical Outlook for $OKB Price
Key levels for $OKB remain clearly defined following its recent breakout above major resistance.
Upside levels now sit at $98.80, $100.00, and $103.50 as immediate hurdles. A sustained breakout above these zones could extend the rally toward $108.00 and $112.00. These levels represent the next expansion targets if bullish momentum continues building.
On the downside, immediate support lies at $94.33, followed by $90.81 and $88.35. A deeper pullback could retest the strong demand zone between $84.80 and $82.80, which previously acted as a major breakout base. Consequently, this region now defines the broader bullish structure. As long as $OKB holds above the 200-day EMA near $93.96, buyers maintain control of the medium-term trend.
The technical structure shows $OKB breaking out of a long consolidation phase with strong momentum expansion. Additionally, price action now trades above key moving averages, confirming a shift in market sentiment. Volatility has also expanded, suggesting active participation from buyers and renewed trend strength.
Will $OKB Go Higher?
$OKB’s near-term direction depends on whether buyers can defend $94.33 and build momentum above $98.80. Besides, sustained inflows and stable derivatives positioning could strengthen the breakout structure. A confirmed daily close above $100 would likely accelerate upside pressure toward higher resistance zones.
However, failure to hold $94.33 may slow momentum and trigger short-term consolidation. Moreover, a break below $90.81 could weaken the bullish structure and shift sentiment temporarily.
For now, $OKB remains in a decisive breakout phase. The next move depends on follow-through buying and sustained volume expansion.

 blockchainreporter.net
 ambcrypto.com


