


 13
13
Solana is holding a key support zone while its longer term chart still points to a possible breakout setup. $SOL needs to reclaim the $87 to $90 range first, but a confirmed move above resistance could keep the wider $1,000 target in play.
Solana Price Chart Shows $1,000 Target as $SOL Holds Long Term Base
Solana is holding above a long term support area while analyst CryptoCurb says the wider chart points to a possible move toward $1,000.
The weekly $SOL chart shows price building a base after a long pullback from the 2025 high area. A green trendline marks support under the structure, while a red descending line shows the short term downtrend that has kept price compressed.
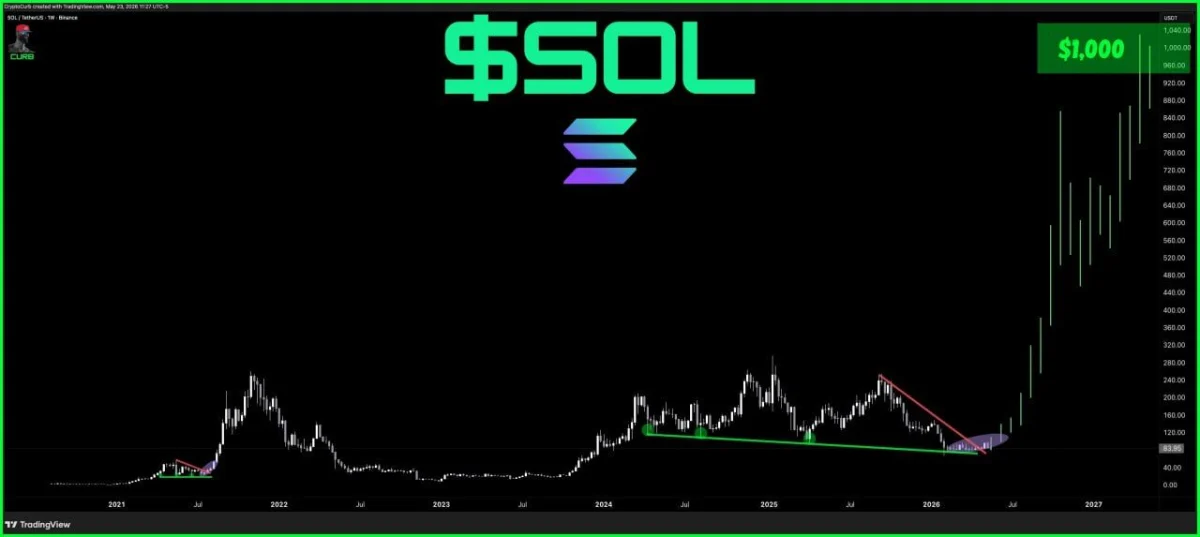
$SOL Weekly Chart. Source: CryptoCurb on X
The chart also highlights a purple zone near the breakout area. This zone appears to mark where $SOL could leave the consolidation range if buyers push price above the descending resistance line.
CryptoCurb’s projection shows $SOL moving sharply higher after the breakout. The chart marks $1,000 as the long term upside target, but that move would need several confirmations first.
The main signal now is compression above support. $SOL has not confirmed the large breakout yet, so the setup depends on whether price can hold the base and clear the red resistance line.
If $SOL breaks above that downtrend with follow through, the chart would shift toward a stronger bullish structure. However, losing the green support line would weaken the setup and delay the $1,000 target.
Solana Price Tests Reversal Zone as $SOL Holds Key Support
Solana is approaching a key reversal zone after following a short term downtrend, according to a chart shared by BitGuru on X.
The chart shows $SOL falling from the $98.18 area after a strong breakout earlier in May. Price then moved below the $87 to $90 resistance zone, which now remains the main level buyers need to reclaim.
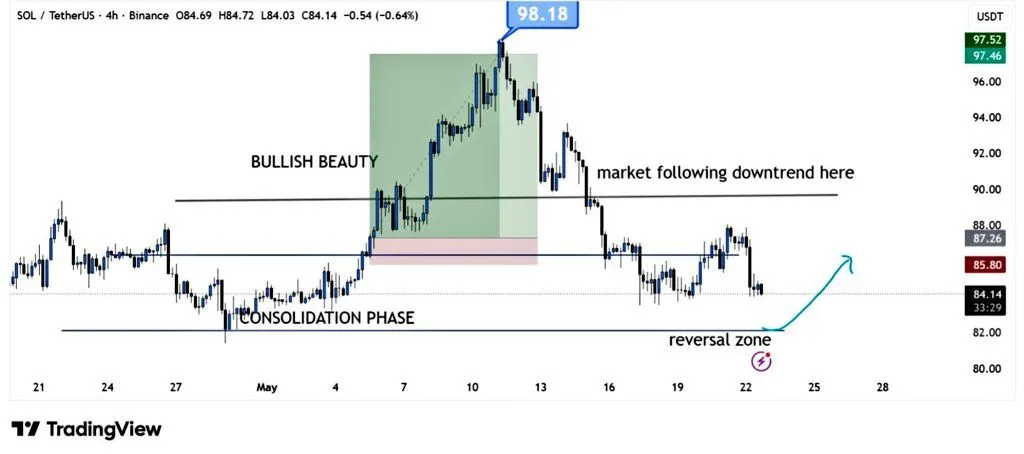
$SOL 4 Hour Chart. Source: BitGuru on X
The nearest support sits around $82 to $84. $SOL is now trading close to that area, where the chart marks a possible reversal zone.
A bounce from this support could push Solana back toward the $87 to $90 range. A clean move above that zone would be the first stronger signal that the short term downtrend is losing strength.
However, the setup still needs confirmation. If $SOL fails to hold the $82 to $84 support area, the reversal case would weaken and price could continue moving lower.
For now, the chart shows Solana at a short term decision point. Buyers need to defend support first, then push price back above resistance to confirm a stronger recovery setup.
