

 5
5
$XRP continued to trade under pressure this week as weakening momentum indicators and declining speculative activity limited recovery attempts. The token hovered near $1.36 after repeated failures to reclaim major resistance zones. Consequently, market sentiment remained cautious despite short-term stabilization around key support levels.
Technical indicators showed that $XRP still traded below its major exponential moving averages on the daily timeframe. The 20-day EMA near $1.40 continued to cap upside movement.
Additionally, the 50-day EMA around $1.41 reinforced near-term selling pressure. Bulls also faced stronger resistance near the 100-day EMA at $1.48 and the 200-day EMA close to $1.68.
The broader structure remained bearish-to-neutral as buyers struggled to regain control. Moreover, $XRP failed to reclaim higher Fibonacci retracement zones that previously supported bullish continuation. Analysts now view the $1.48 level as a critical pivot for any stronger recovery attempt.
Key Levels Define $XRP’s Next Move
The current market structure highlighted several important price zones. Immediate support remained between $1.30 and $1.32, where $XRP repeatedly attracted buyers during recent consolidation phases. However, a decisive breakdown below this range could expose the larger support zone near $1.11.
On the upside, traders monitored the Fibonacci 0.236 retracement level near $1.41. Beyond that, stronger resistance stood near $1.76 and later around $2.13. Hence, $XRP would likely need sustained buying pressure before testing those higher targets.
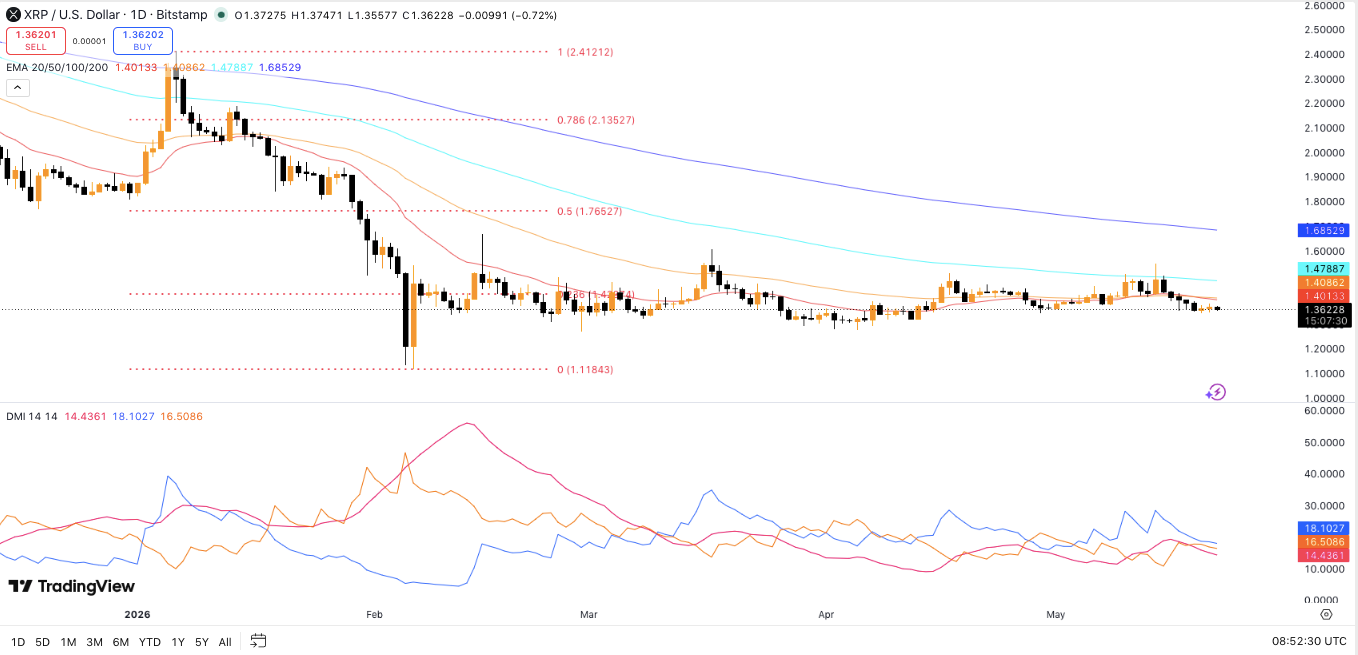
Momentum indicators also reflected the market’s indecision. The Average Directional Index stayed near 14.4, signaling weak overall trend strength. Besides, the Directional Movement Index showed only a slight bullish advantage as the positive directional indicator remained marginally above the negative indicator.
Related: $NEAR Protocol Price Prediction: $NEAR Surges Over 40% as Open Interest Climbs Above $470 Million
This setup suggested that neither bulls nor bears currently controlled the market decisively. Consequently, $XRP continued moving within a consolidation range instead of forming a strong directional trend.
Open Interest and Exchange Flows Reveal Weak Confidence
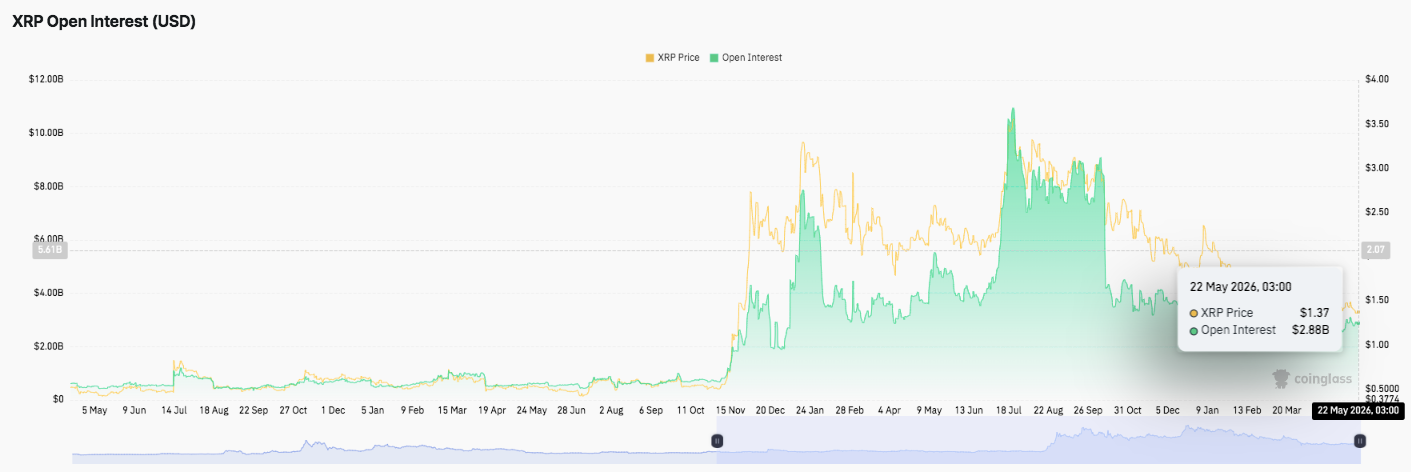
$XRP’s derivatives market now reflects noticeably weaker speculative activity. Open interest previously surged above $10 billion during $XRP’s sharp rally toward the $3.50 region. However, leveraged participation has steadily declined since that peak.
Current open interest levels dropped closer to $2.8 billion as traders reduced exposure and closed speculative positions. Moreover, the decline occurred alongside falling prices, which often signals weakening market conviction rather than fresh accumulation.
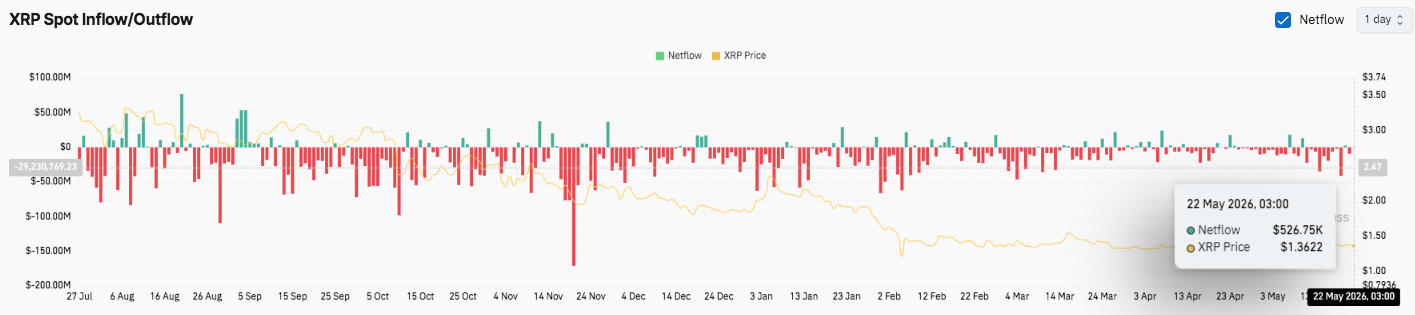
Spot exchange activity also reflected defensive behavior among investors. Exchange outflows consistently exceeded inflows throughout the observed period. Although occasional inflow spikes appeared, they failed to establish lasting bullish momentum.
Related: Bitcoin Price Prediction: Saylor Calls It a Spring Phase as BTC ETFs Bleed $2.15B in Two Weeks
Consequently, traders appeared focused on capital preservation instead of aggressive accumulation. If $XRP stabilizes above support while open interest levels flatten, the market could gradually build a stronger foundation for a future breakout.
Technical Outlook For $XRP Price
Key levels remain critical for $XRP as the asset trades inside a weak recovery structure following its rejection below higher Fibonacci resistance zones.
Upside levels: $1.41 remains the first immediate hurdle, followed by $1.48 and the stronger resistance cluster near $1.68. A confirmed breakout above $1.48 could accelerate momentum toward $1.76 and potentially $2.13 if bullish participation strengthens.
Downside levels: Initial support sits around $1.30–$1.32, which continues attracting buyers during consolidation. Below that, the major structural support remains near $1.11. Losing this zone could expose $XRP to a sharper corrective phase.
Resistance ceiling: The $1.48 region, aligned with the 100-day EMA, remains the key level bulls must reclaim to restore medium-term bullish momentum. Additionally, the 200-day EMA near $1.68 continues to cap broader upside expansion.
The technical structure suggests $XRP is consolidating after an extended cooldown in both price action and open interest activity. Moreover, declining leverage participation signals cautious positioning across the derivatives market. However, stabilization in open interest could support a stronger accumulation phase if buyers defend current support zones.
Will $XRP Go Up?
$XRP price prediction now depends heavily on whether bulls can sustain price action above the $1.30–$1.32 support range long enough to challenge the $1.41–$1.48 resistance cluster. Consequently, a successful breakout could trigger renewed momentum toward $1.76 and possibly $2.13.
Related: Cardano Price Prediction: Hoskinson Warns IOG Lab Shuts Down if 32.9M ADA Vote Fails on June 8
However, failure to maintain support near $1.30 may weaken sentiment further and expose $XRP to a deeper decline toward $1.11. For now, $XRP remains in a decisive consolidation phase, where improving inflows and stronger market participation could determine the next major directional move.