

 3
3
$XRP price started a recovery wave above $1.3620 and $1.3650. The price is now consolidating and might aim for a fresh move if it clears $1.3840.
- $XRP price started a recovery wave above the $1.3640 zone.
- The price is now trading below $1.3820 and the 100-hourly Simple Moving Average.
- There is a contracting triangle forming with resistance at $1.380 on the hourly chart of the $XRP/USD pair (data source from Kraken).
- The pair could continue to move up if it settles above $1.3840.
$XRP Price Eyes Fresh Gains
$XRP price remained supported above $1.350 and started a recovery wave, like Bitcoin and Ethereum. The price was able to climb above $1.3580 and $1.3620 to enter a short-term positive zone.
However, the price is still below $1.3850 and the 23.6% Fib retracement level of the downward move from the $1.5495 swing high to the $1.3465 swing low. There is also a contracting triangle forming with resistance at $1.380 on the hourly chart of the $XRP/USD pair.
The price is now trading below $1.3750 and the 100-hourly Simple Moving Average. If there is a fresh upward move, the price might face resistance near the $1.3780 level. The first major resistance is near the $1.380 level.
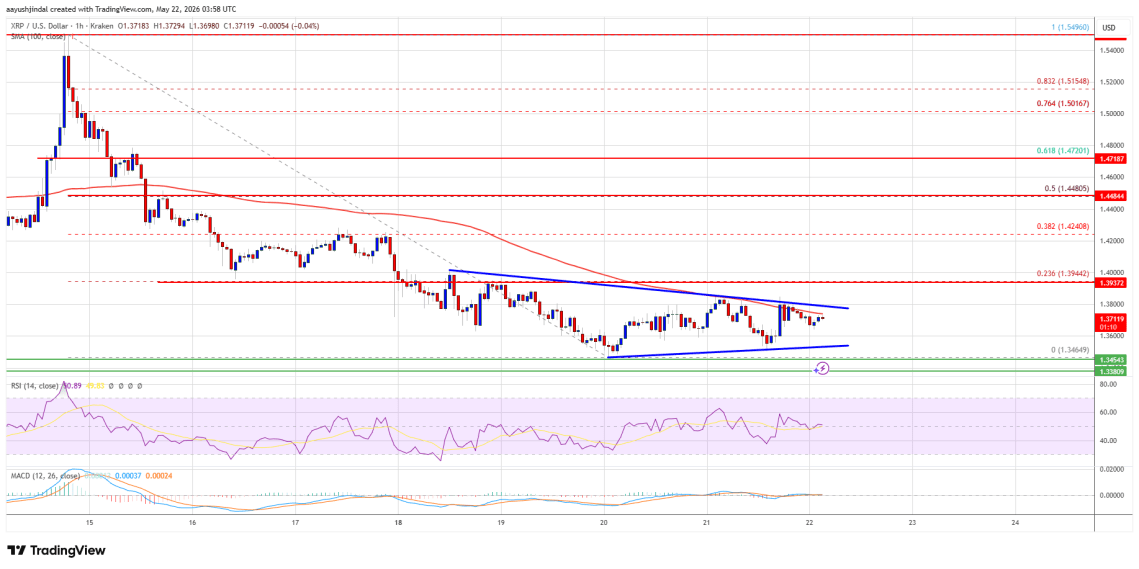
A close above $1.380 could send the price to $1.3840. The next hurdle sits at $1.3940. A clear move above the $1.3940 resistance might send the price toward the $1.420 resistance. Any more gains might send the price toward the $1.4480 resistance or the 50% Fib retracement level of the downward move from the $1.5495 swing high to the $1.3465 swing low.
Another Decline?
If $XRP fails to clear the $1.3840 resistance zone, it could start a fresh decline. Initial support on the downside is near the $1.360 level. The next major support is near the $1.3580 level.
If there is a downside break and a close below the $1.3580 level, the price might continue to decline toward $1.340. The next major support sits near the $1.3380 zone, below which the price could continue lower toward $1.3250.
Technical Indicators
Hourly MACD – The MACD for $XRP/USD is now losing pace in the bullish zone.
Hourly RSI (Relative Strength Index) – The RSI for $XRP/USD is now above the 50 level.
Major Support Levels – $1.3600 and $1.3580.
Major Resistance Levels – $1.3840 and $1.3940.

