
 3
3
$XRP is the worst performer among the top 10 cryptocurrencies by market cap, up less than 1% in the last 24 hours.
However, the aggressive accumulation of $XRP ETFs by institutional investors could push $XRP’s price higher in the near term.
The momentum indicators also suggest a growing bullish narrative.
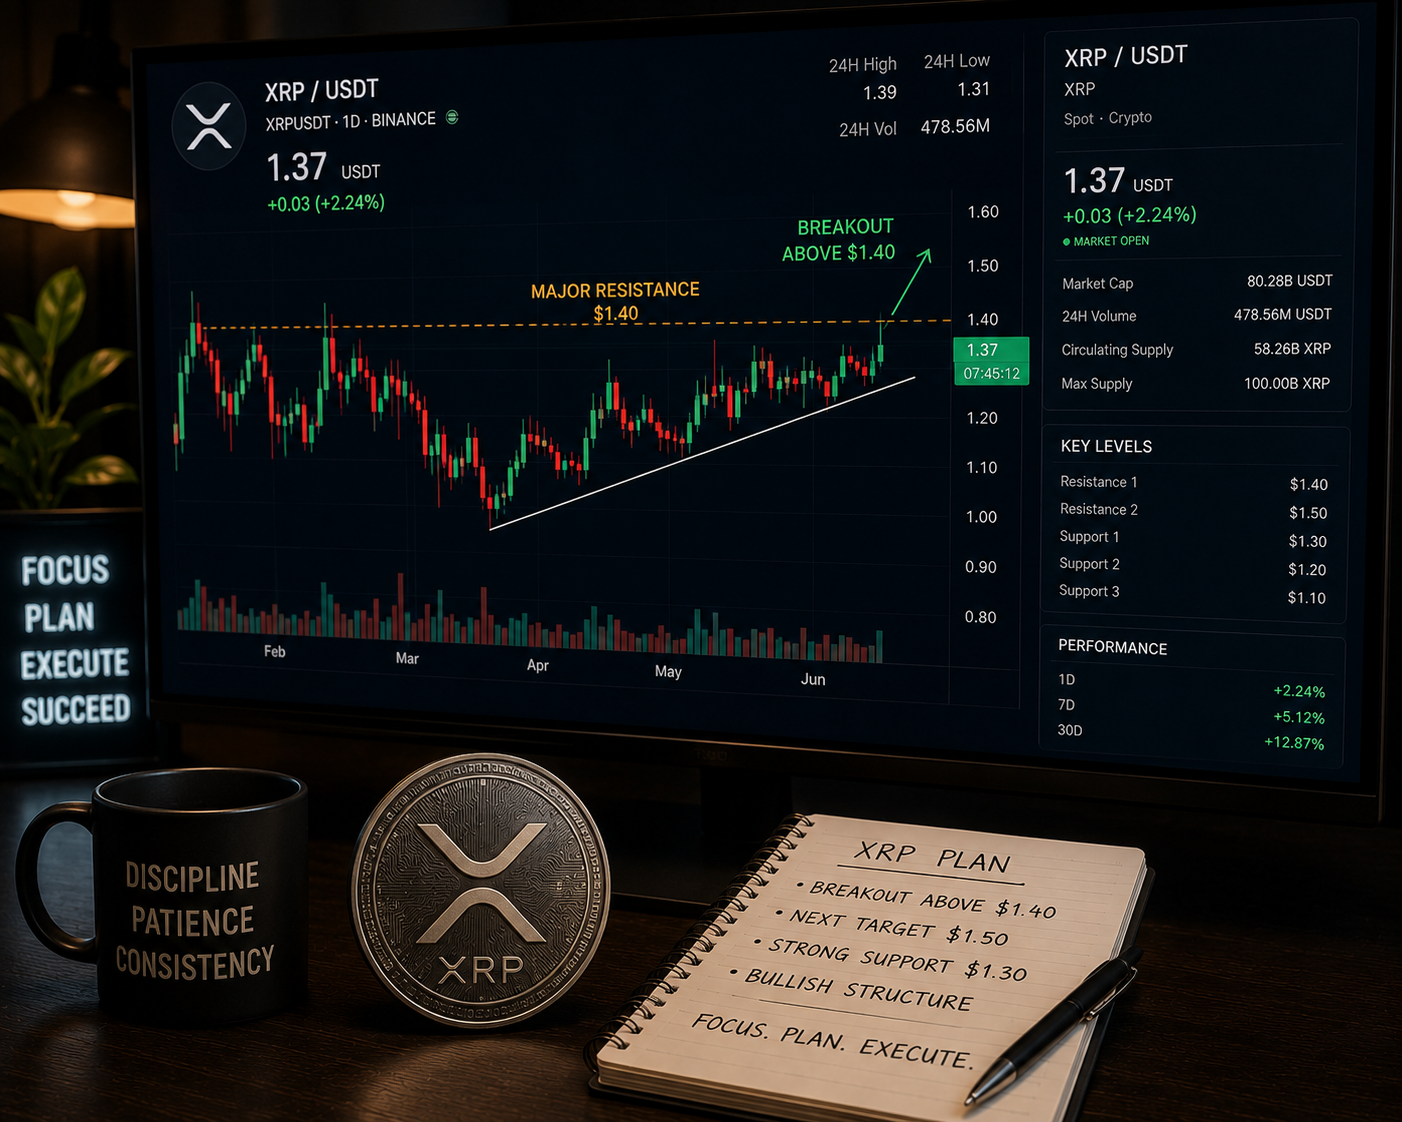
$XRP stays above $1.37 amid growing ETF inflow
$XRP has defended the $1.32 support level over the past few days and could be preparing for a potential breakout above $1.40 in the near term.
Despite $XRP’s poor performance, institutional demand has increased over the past few days.
CoinGlass data shows that $XRP’s spot ETFs recorded an inflow of $1.5 million on Wednesday, marking the fifth consecutive day of positive flows since last week.
The ETF inflows indicate institutional confidence in $XRP, and this could push its price higher in the near term.
The on-chain and derivatives data also show a mild bullish bias for $XRP. According to CyptoQuant, $XRP’s spot market is showing cooling conditions.
The derivatives side supports a positive outlook. CoinGlass’s futures Open Interest (OI) now stands at $2.9 billion, up by 1% in the last 24 hours.
The long-to-short ratio reads 1.02, indicating a bullish sentiment as traders are betting on $XRP’s price increase.
Finally, the funding rate for $XRP flipped positive on Monday and now reads 0.0027%. The positive rate indicates that longs are paying shorts and projecting a bullish sentiment.
The positive performance of the broader crypto market comes after the US President Donald Trump announced on Wednesday that the ongoing negotiations with Iran are in their final stages.
This latest development has raised hopes for a potential agreement between the two countries, improving the broader market sentiment and allowing $XRP and Bitcoin to hold above key support levels.
$XRP price forecast: Bulls prepare for a breakout
The $XRP/USD 4-hour chart remains bearish as it is the worst performer among the top 10 cryptocurrencies by market cap.
At press time, $XRP is trading at $1.373, below the 50-day Exponential Moving Average (EMA) of $1.411.
The momentum indicators are no longer in the oversold regions, indicating a fading bearish trend.
The Relative Strength Index (RSI) is hovering around 44, and the Moving Average Convergence Divergence (MACD) line is holding below zero, suggesting that buyers are slowly regaining control of the market.
If the buyers reclaim control, they would encounter initial resistance at the $1.411 level, with another major zone at $1.427.
A daily candle break above these levels would allow the bulls to extend their rally towards the $1.48 resistance zone, with the $1.50 psychological level also a target.
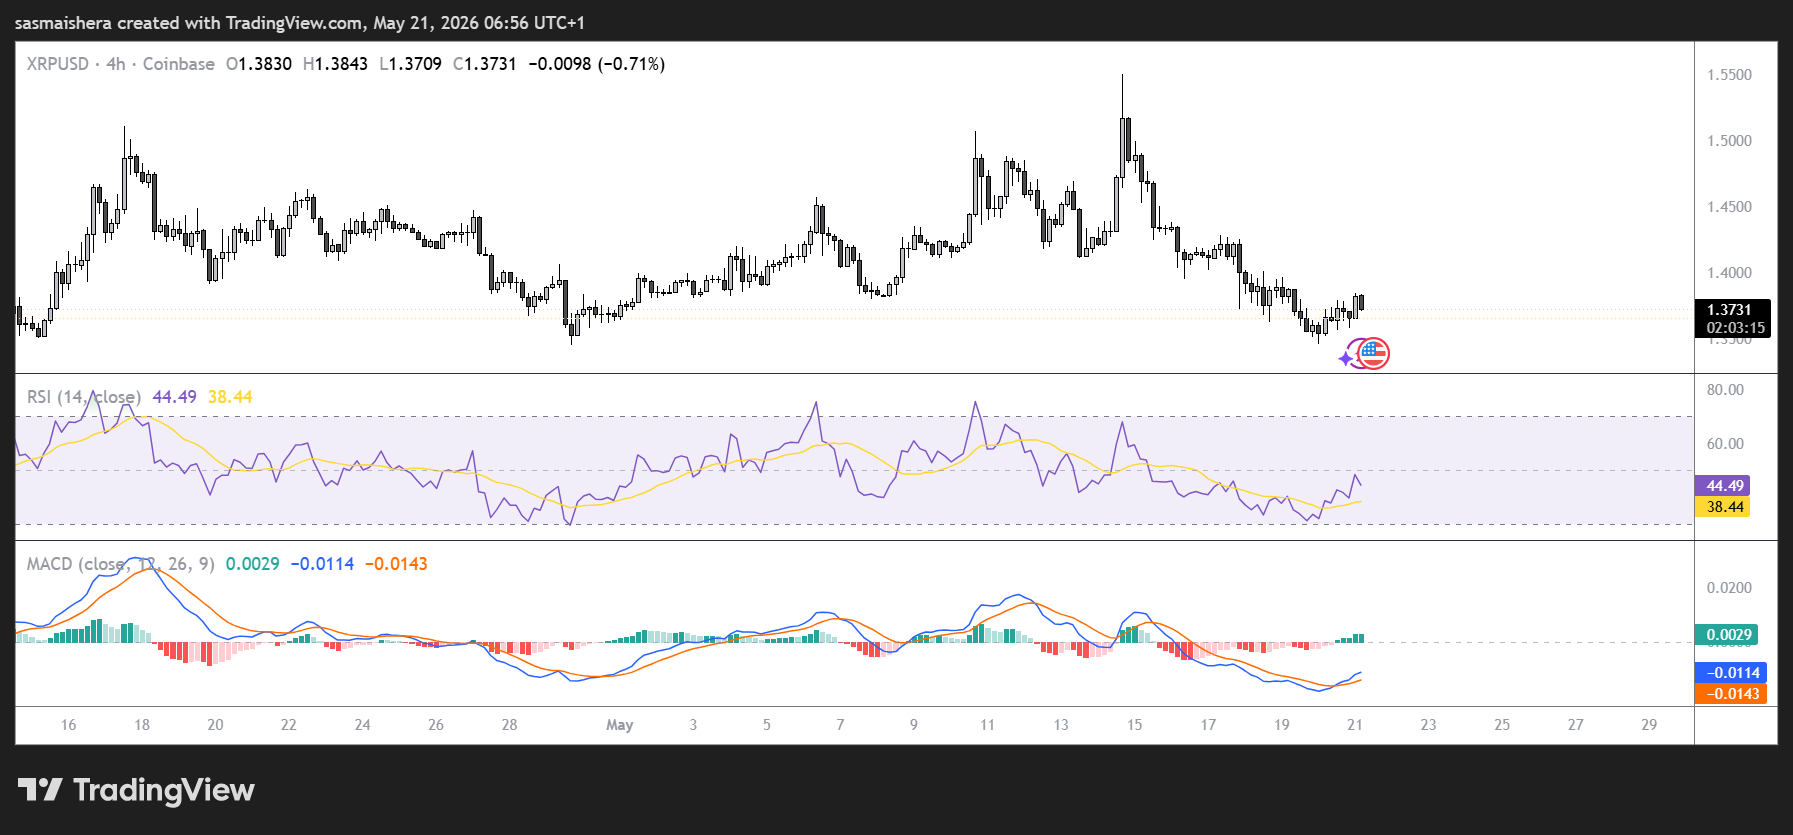
However, if the selloff resumes, the buyers will need to defend the initial support at $1.32 to enable $XRP to bounce back faster.
Losing this support level would expose $XRP to lower floors below $1.30, making it harder for a recovery effort in the near term.