


 3
3
Shiba Inu trades at $0.0000578 on May 19, breaking below the rising channel that held since February and losing all four EMAs in the same move, as the burn rate crashes 78% week-over-week and macro pressure from rising Treasury yields hits risk assets across the board.
Is $SHIB’s Channel Recovery Over? What the Daily Chart Shows
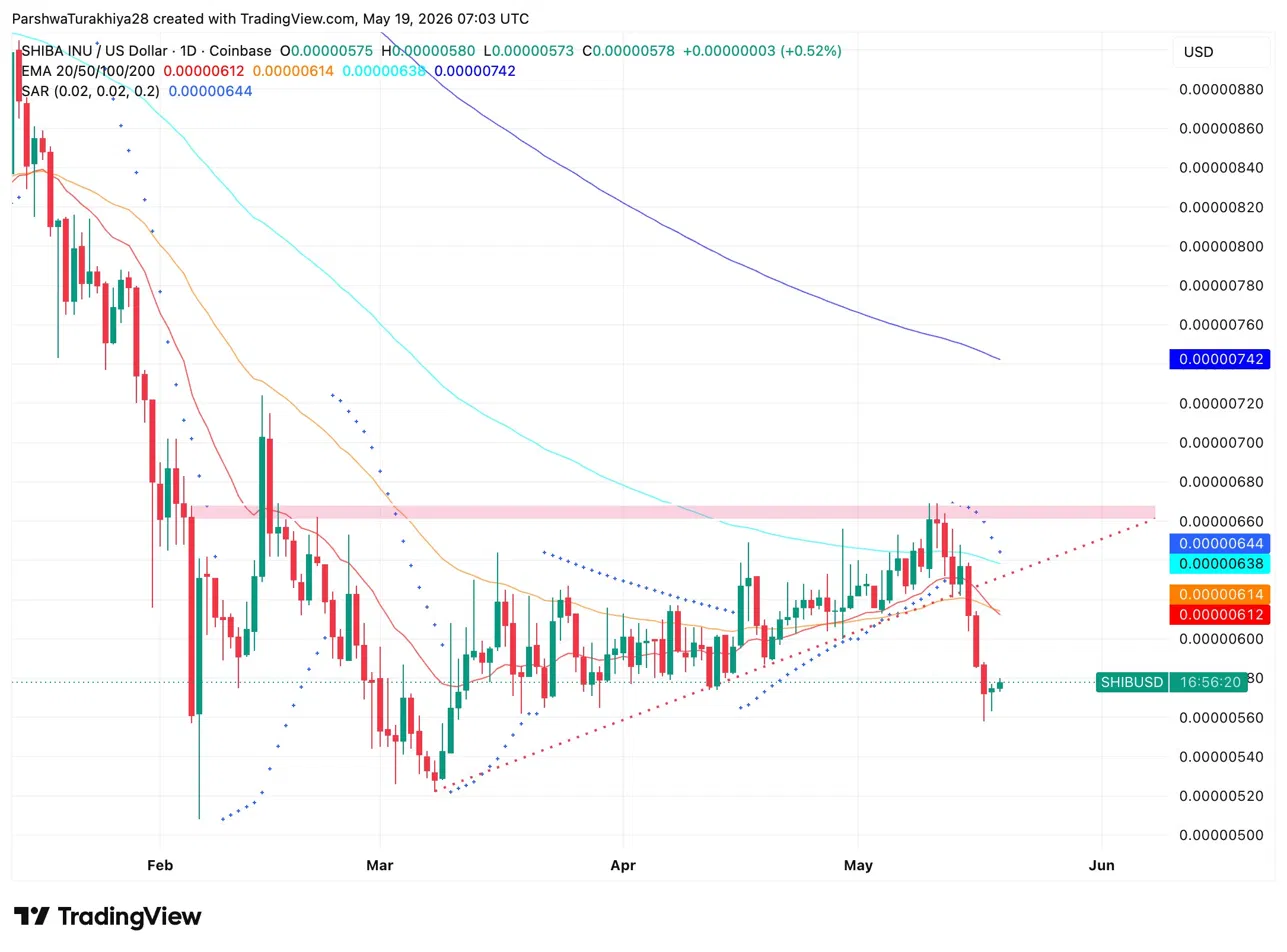
$SHIB held a rising channel from the February lows and spent most of April and May building toward the $0.0000660 resistance band. That structure is now gone. Price broke below the channel base and is sitting at $0.0000578, below the 20 EMA at $0.0000612, 50 EMA at $0.0000614, 100 EMA at $0.0000638, and 200 EMA at $0.0000742. All four EMAs are overhead. The SAR at $0.0000644 is bearish.
Below current price, the February consolidation zone near $0.0000550 to $0.0000560 is the nearest support. That area held through most of March and is where the channel originated. Losing $0.0000550 on a daily close opens a move toward $0.0000520, the last meaningful level before the February lows.
Key levels:
- Resistance: $0.0000612 (20 EMA), $0.0000638 (100 EMA), $0.0000660 resistance band
- Support: $0.0000550 to $0.0000560 February base, $0.0000520
- SAR: Bearish at $0.0000644
$SHIB Burn Rate Down 78%: The May 15 Spike Was a One-Off
Burn activity spiked to nearly 28 million tokens on May 15, driven almost entirely by a single wallet transaction. Since then, the rate has collapsed 77.97%, falling back to near zero by May 19. The 24-hour burn rate is also down 32.10%, tracking the same trend.
This is the same pattern flagged after the earlier 1034% single-day spike. One wallet creates a headline number, burn activity falls sharply in the days after, and the supply-reduction argument loses its near-term credibility. Sustained community-driven burning, not periodic single-wallet events, is what the long-term $SHIB bull case requires. That has not materialized.
$SHIB Derivatives: New Positions Being Built Into a Falling Price
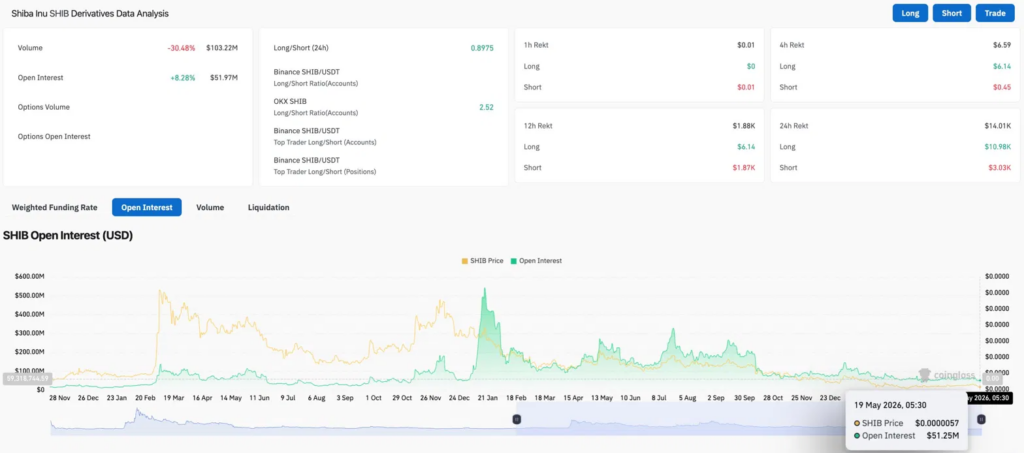
Volume dropped 30.48% to $103.22M while open interest rose 8.28% to $51.97M. Volume down with OI up means new positions are being opened quietly rather than existing ones being traded actively. OKX accounts show a 2.52 long ratio. Over 24 hours, $10.98K in longs were liquidated against $3.03K in shorts. Both figures are small, reflecting the low overall positioning size in $SHIB right now rather than any directional conviction.
The OI increase into a price decline is worth watching. If those are new longs being built at support, a recovery bounce becomes possible. If they are new shorts, the downside accelerates.
Shiba Inu Price Prediction: Upside and Downside for May 20
- Upside: Holding $0.0000550 and reclaiming the 20 EMA at $0.0000612 on a daily close reopens the resistance band between $0.0000630 and $0.0000660. A macro recovery in BTC above $79,000 and sustained burn activity returning above 5M tokens weekly would support the move.
- Downside: Losing $0.0000550 on a daily close puts $0.0000520 in play. Treasury yields staying elevated above 4.60% and continued macro pressure keep $SHIB capped. Without a meaningful shift in burn activity or a broader altseason catalyst, the path of least resistance remains lower.