


 15
15
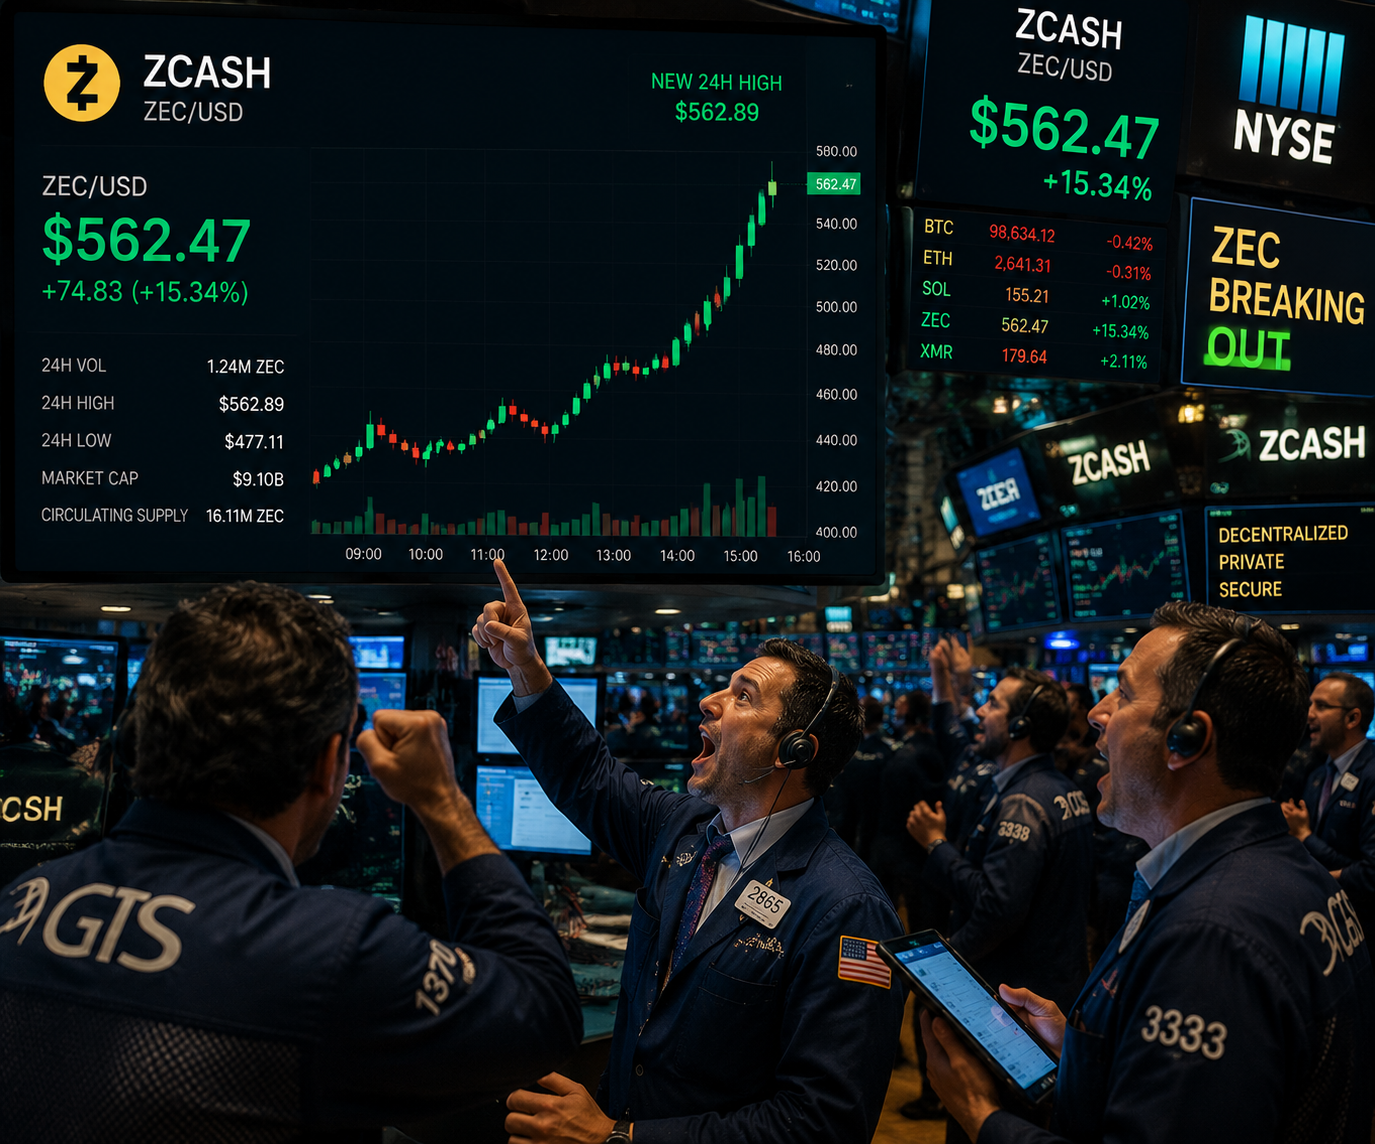
Zcash ($ZEC) is the best performer among the top 20 cryptocurrencies by market cap, adding over 6% to its value.
The rally has allowed $ZEC to reclaim the $560 mark, with the bulls now targeting higher liquidity zones.
The technical outlook remains extremely bullish, with momentum indicators suggesting further room for growth.
$ZEC surges 6% as volatility returns
$ZEC is trading at $566 at press time on Tuesday, outperforming the broader cryptocurrency market.
The positive performance comes as retail interest in Zcash returns. According to CoinGlass, $ZEC’s futures Open Interest (OI) now stands at $1.23 billion, up 35% over the last 24 hours.
The OI has been increasing since April 29, coinciding with $ZEC’s rally from $320 to its current price of $566.
The rising OI indicates increased retail participation, with traders optimistic that $ZEC’s price could rally higher in the near to medium term.
$ZEC’s 4-hour and daily charts show that the coin has been producing lower highs through the correction, with each recovery attempt getting rejected near the upper channel resistance in recent months.
By reclaiming the macro resistance zone around $560, $ZEC could be creating a possible compound breakout.
This suggests that $ZEC is not only trying to escape the descending pattern but reclaim a major liquidity zone above.
$ZEC’s rally is also supported by renewed market attention. According to LunarCrush, $ZEC’s price has continued to move higher even while the broader crypto market remains weak.
Despite that, social activity has not yet returned to the euphoric levels seen in late 2025. Currently, Zcash’s social dominance stands at 0.96%, while the November 2025 peak was around 2.56%.
If the social sentiment improves, $ZEC could extend its rally in the near term and approach higher liquidity zones.
Zcash technical outlook: $ZEC eyes the $745 liquidity zone
The $ZEC/USD 4-hour chart is bullish and efficient as Zcash is outperforming the broader cryptocurrency market.
The momentum indicators are also bullish, suggesting a further rally in the near term. The Relative Strength Index (RSI) of 63 means that Zcash is now approaching the overbought region.
The MACD lines crossed into the bullish area last week. If the bulls remain in control, $ZEC could retest the first major resistance level at $598 over the next few hours or days.
A decisive close above this level could allow $ZEC to target the monthly high of $641. Above this resistance level is the liquidity zone at $745, the high created during the November 2025 market rally.
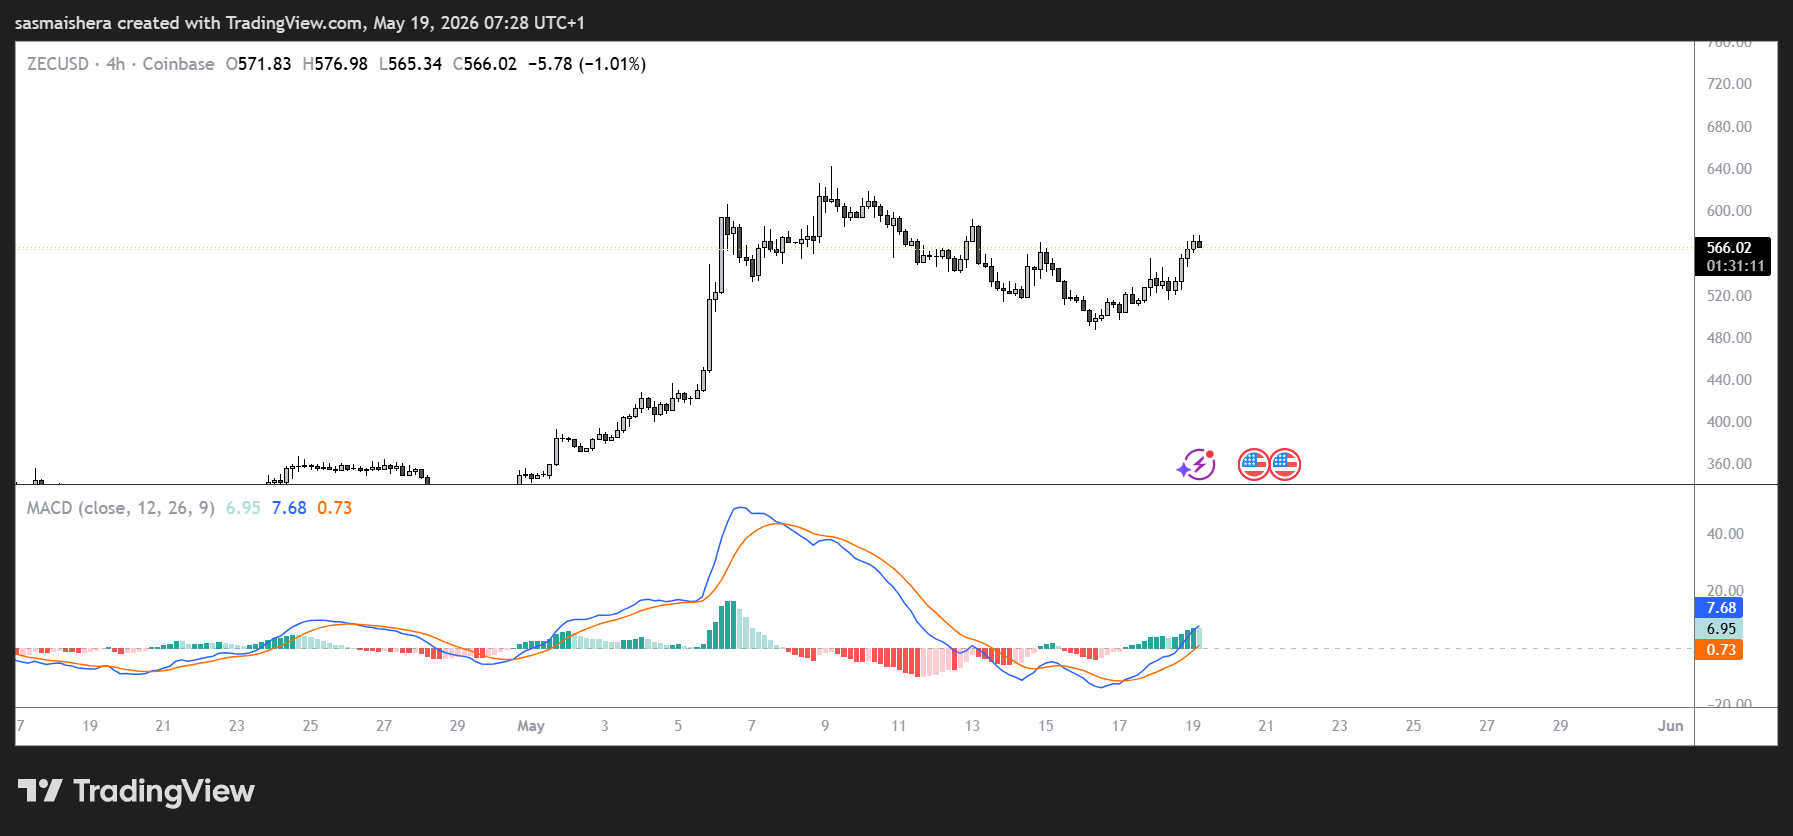
However, if the bulls fail to push $ZEC above the $641 resistance level, it could encounter a correction and drop towards the Monday low of $518.
A daily candle close below $518 could see $ZEC retest a lower support level at $488, with another major support at $410 also a possibility.

