

 12
12
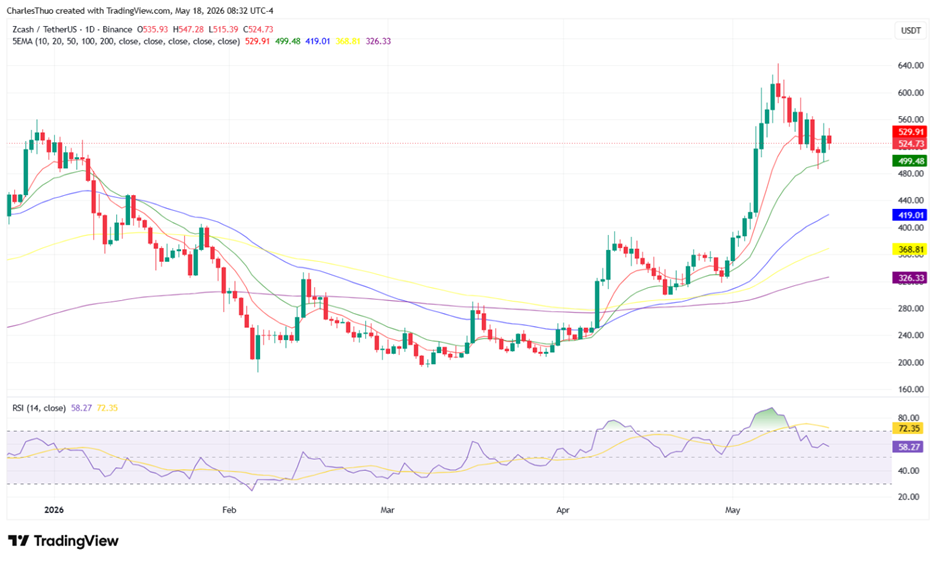
At the time of writing, $ZEC was trading around $524.73, with a 24-hour range of $510.70 to $550.10.
Resistance builds as $ZEC struggles above $550
The $550 level has emerged as an important short-term barrier.
Recent price action shows repeated attempts to hold above this region, but each push has been met with selling pressure that forces the price back into the mid-$510 range.
This type of movement often signals that the market is still in a consolidation phase rather than a clean breakout trend.
Across broader technical projections, the next major resistance zone is positioned near $560, followed by a stronger supply area between $600 and $642.
A decisive daily close above $600 is widely viewed as the threshold that would confirm continuation of the broader uptrend.
Until that happens, rallies are likely to face rejection as traders take profit near resistance.
On the downside, immediate support is forming around the recent consolidation zone near $518, with a deeper support layer sitting at approximately $504, where the 100-day exponential moving average is located.
A breakdown below this region would weaken the current bullish structure and expose the market to a broader retracement phase.
Indicators show bullish bias, but short-term weakness is visible
Despite the recent pullback, the overall technical structure remains tilted to the upside.
Out of 23 tracked indicators, 11 are currently bullish, compared to 3 bearish signals and 9 neutral readings.
This distribution suggests that the broader trend is still supported, even though momentum is not strongly directional in the short term.
The daily chart shows 10 buy signals versus 2 sell signals, with $ZEC trading above the 20-day, 50-day, 100-day, and 200-day EMAs.
The only short-term resistance remains the 10-day EMA, which is currently acting as a ceiling during minor pullbacks.
The Relative Strength Index (RSI) sits at 58.27, placing it firmly in neutral territory.
This indicates that $ZEC is neither overbought nor oversold, leaving room for movement in either direction depending on volume and market participation.
However, there is a notable divergence between price action and momentum.
$ZEC has recorded a 7-day decline of 12.2%, even as indicator readings remain broadly positive.
This type of divergence often reflects a market in transition, where trend strength is still intact but short-term conviction has weakened.
Leverage-driven activity and uneven participation
Recent data on trading behaviour highlights an important structural shift in Zcash’s market dynamics.
Over the past several months, spot trading volume has been trending downward, while perpetual futures volume has continued to increase.
This imbalance suggests that a growing share of price movement is being driven by leverage rather than sustained spot demand.
This type of structure can create sharper price swings, particularly during periods of sentiment change.
In previous cycles, similar conditions were observed near a lower high around $540, after which $ZEC experienced a rapid decline toward approximately $185 within six weeks.
The key factor in that move was a lack of spot demand strong enough to absorb leveraged positioning when momentum reversed.
At present, open interest is showing signs of recovery after a recent pullback, indicating that traders are re-entering positions.
However, without corresponding growth in spot volume, the sustainability of the current move remains closely tied to derivatives activity.
Key levels defining the Zcash ($ZEC) next move
Zcash is now trading in a tightly defined range where the next directional move is likely to be decided by volume confirmation and breakout strength.
The immediate resistance zone sits at $550 – $560, with the major breakout zone at $600 – $636.
A sustained move above $600 would shift focus toward continuation of the broader uptrend.
Looking at the current pullback, the altcoin must hold the short-term support zone around $518 – $504 to give the bullish moment a chance of resumption.
A drop below $504 would increase the risk of a deeper correction phase.


