

Dogecoin is holding inside a long-term accumulation range as analysts compare the current $DOGE setup with earlier mini cycles that came before major rallies.
The latest charts show $DOGE still needs a confirmed breakout, but the $0.07–$0.10 support zone remains the key area for the broader bullish structure.
Dogecoin Mini Cycles Show New Accumulation Range
Dogecoin is trading inside a broad range that the chart labels as a possible third accumulation phase.
The chart shared by Bitcoinsensus compares the current $DOGE structure with two earlier accumulation periods. Both earlier ranges came before strong upside moves, with one expansion marked near 190% and the next marked near 480%.
The first accumulation phase formed through 2023 and early 2024. $DOGE then broke higher and moved into a sharp rally before cooling again.

Dogecoin Mini Cycles Chart. Source: Bitcoinsensus on X
The second accumulation phase appeared later in 2024. After that range, $DOGE made a much larger move and reached the upper area near the long-term rising resistance line.
The current setup is marked as “Accumulation 3?” on the chart. $DOGE has spent months inside a wide sideways-to-lower range after its previous peak, while price now sits near the lower part of that zone.
A descending blue trendline still caps the structure from above. That means $DOGE has not confirmed a breakout from the current accumulation range yet.
For now, the chart points to compression rather than confirmation. $DOGE would need to break above the descending trendline and reclaim the upper part of the range to support a stronger bullish continuation setup.
Dogecoin Holds Accumulation Zone as Analyst Points to $1–$3 Targets
Dogecoin is trading inside a long-term accumulation zone marked between $0.07 and $0.10 on the two-week chart shared by Crypto Patel.
The chart shows $DOGE holding near the same broad support area that formed before earlier breakout attempts. This zone sits above the lower horizontal support near $0.05636 and below the mid-range level around $0.11161.
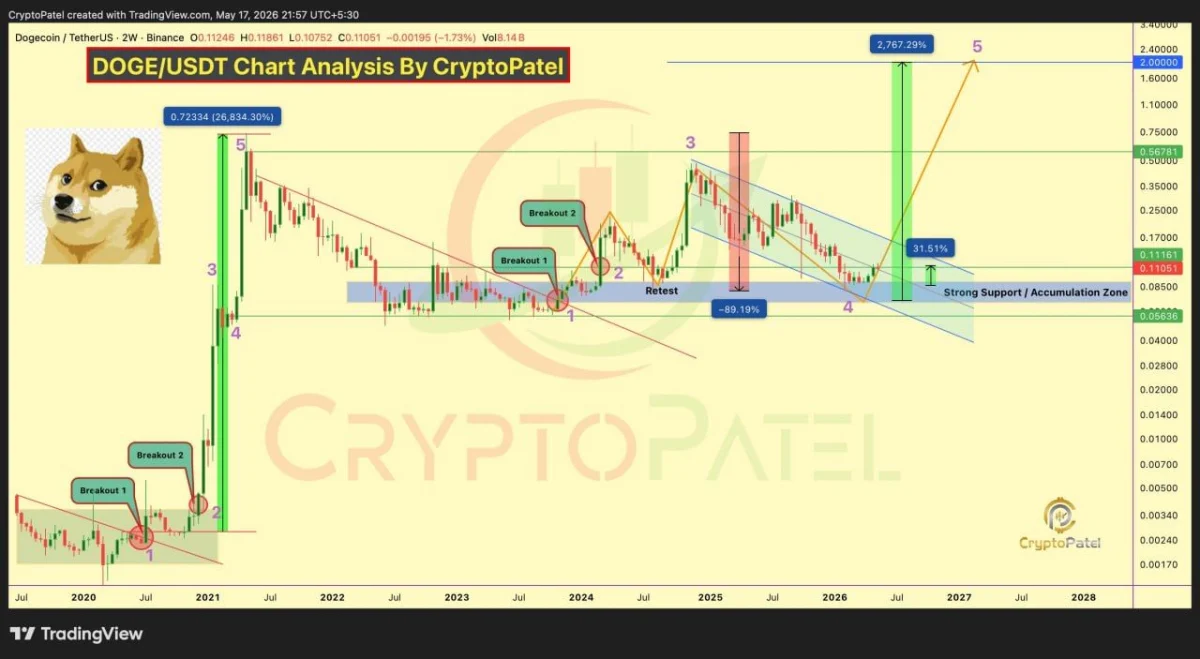
Dogecoin Accumulation Zone Chart. Source: Crypto Patel on X
Crypto Patel marked the current area as a “Strong Support / Accumulation Zone.” The chart shows $DOGE moving inside a descending blue channel after a sharp correction from its previous 2024 high.
The setup also compares the current structure with the 2020–2021 cycle. In that earlier period, $DOGE broke out from a long accumulation range before a large rally. The chart labels similar breakout and retest points in the current cycle.
The first nearby target on the chart sits around $0.11161, while the next major resistance is near $0.56781. A stronger long-term move would need $DOGE to clear that higher resistance before larger targets come into focus.
Crypto Patel listed upside targets at $1, $2, and $3. The chart also highlights $2 as a possible long-term target, but that remains far above the current structure and would require a full market expansion.
For now, the chart shows $DOGE still in accumulation rather than confirmed breakout. The key level to watch is the $0.07–$0.10 zone, because losing it would weaken the long-term bullish setup.
