


 18
18
$XRP is about to enter a technical compression zone, which could lead to a significant increase in volatility in the upcoming weeks. Price action has become more compressed between converging support and resistance levels, following months of intense downward pressure and extended consolidation in the $1.30-1.40 range. In the past, such a structure seldom lasted long before a clear breakout or breakdown took place.
$XRP's recovery outlined on the chart
According to the current chart, $XRP is repeatedly testing resistance close to the 100-day moving average at $1.49, while progressively regaining short-term moving averages. Although buyers have been able to sustain higher lows in April and May, bullish momentum appears tentative. Thus far, every attempt at a breakout has stalled before becoming a full continuation.
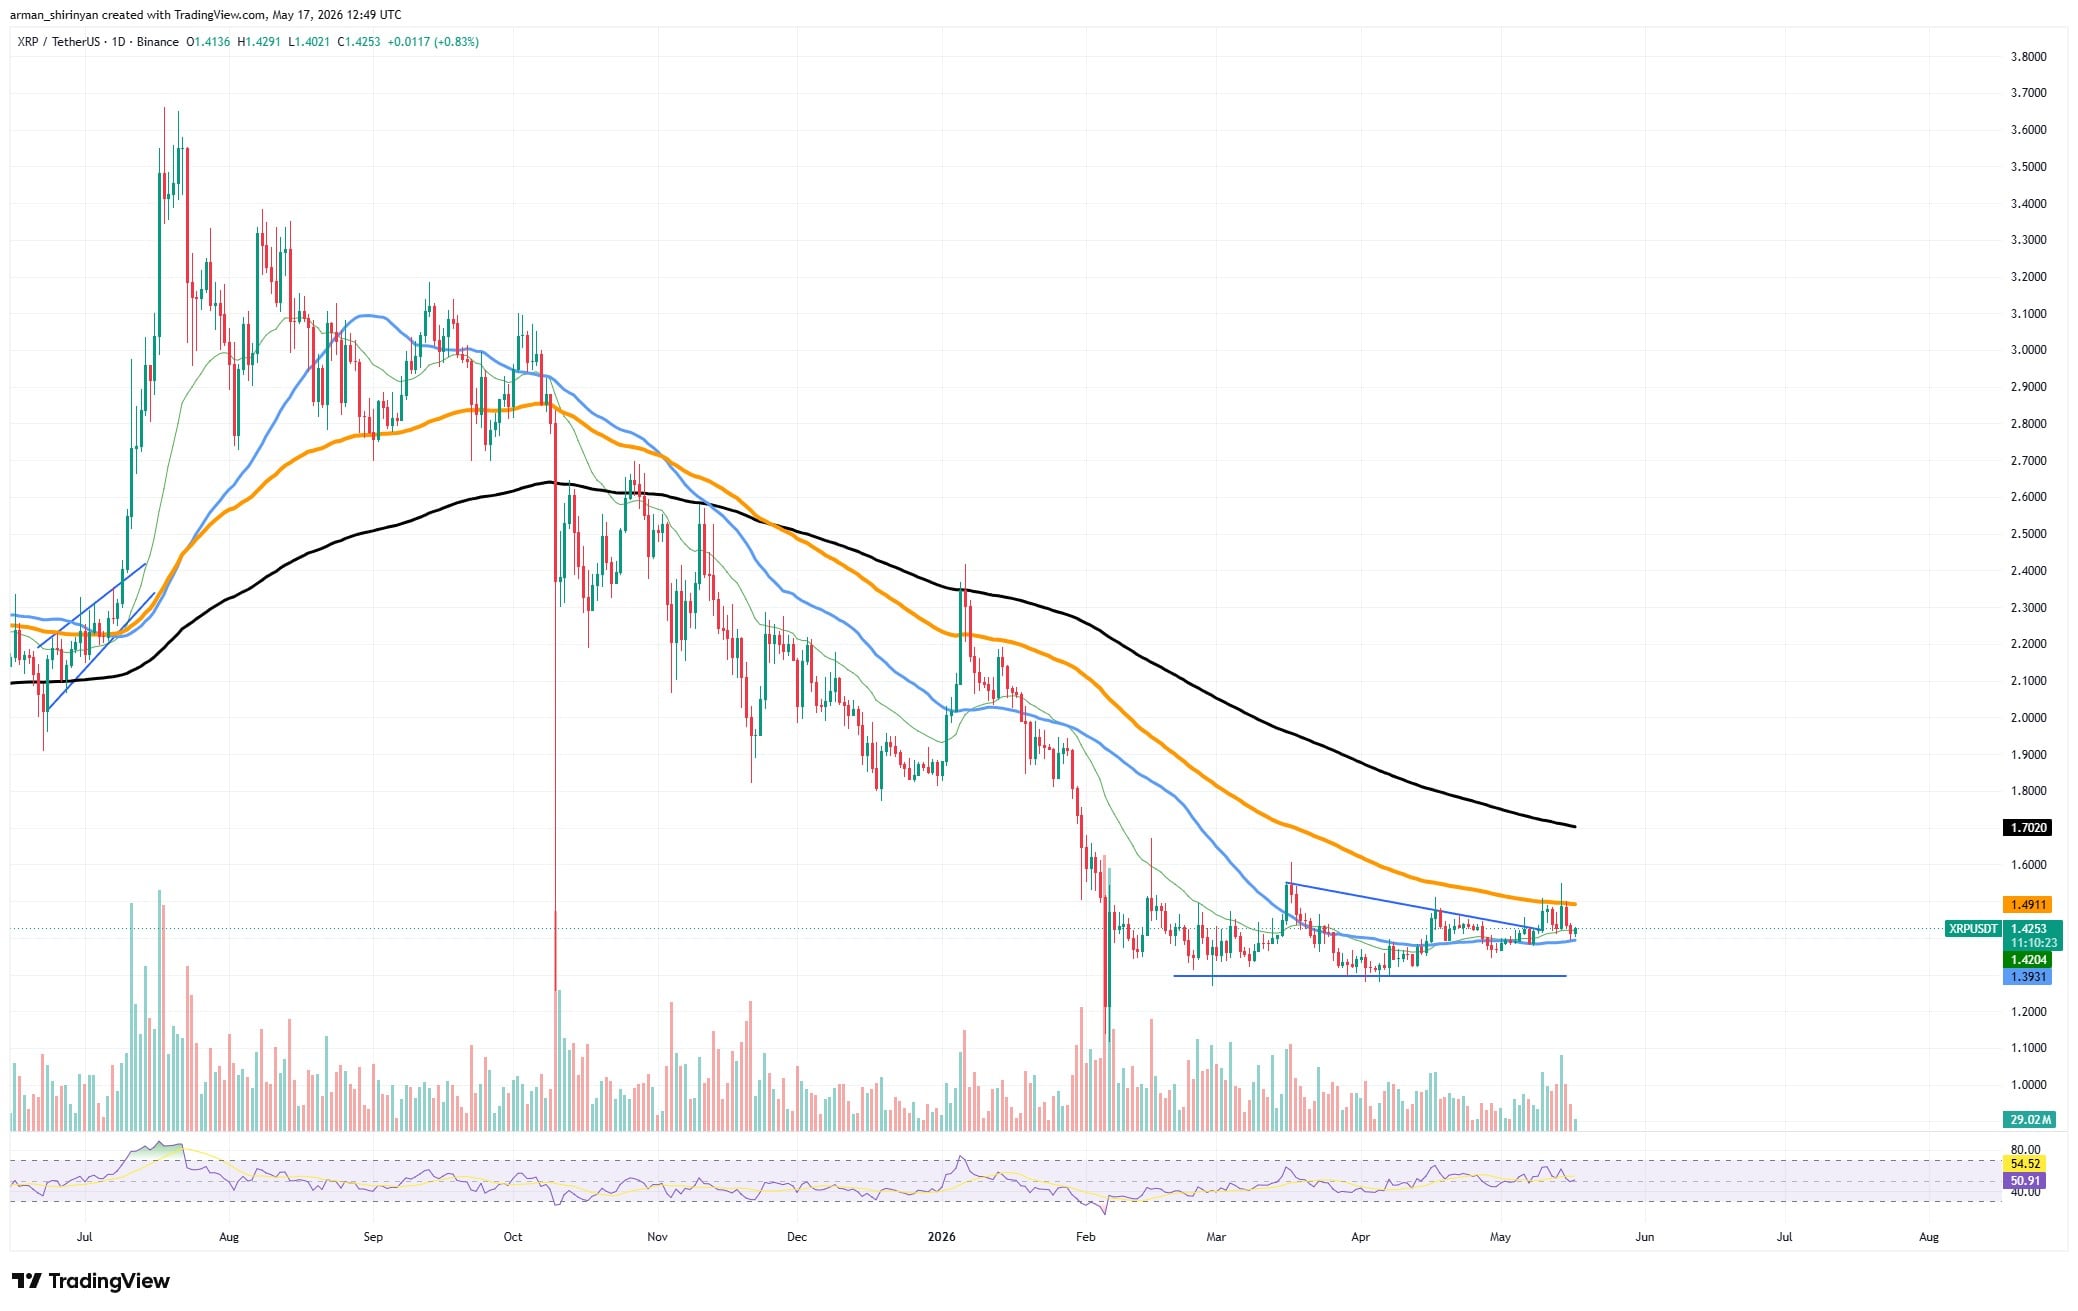
Because $XRP's volatility has been gradually decreasing for weeks, this tightening structure is important. In contrast to the sharp fluctuations observed earlier in this cycle, candlestick ranges shrank, volume cooled following previous spikes, and price began to move inside a much smaller range. Compressed volatility typically has the effect of increasing market pressure. The ensuing move may quickly turn aggressive once the range finally breaks.
Technically speaking, $XRP is currently trading slightly above the 20-day and 50-day moving averages, which is advantageous for short-term bulls. Additionally, the RSI is close to neutral territory in the mid-50s, indicating that neither buyers nor sellers currently have complete control over momentum. However, the larger picture is still unclear because $XRP is still trading below the 200-day moving average at about $1.70, indicating that the macro trend has not yet fully turned bullish.
The crucial resistance range is located between $1.49 and $1.55. Momentum buying would probably be triggered by a confirmed breakout above that area, which could pave the way for $1.70 and higher. Failing to overcome resistance, however, might have the opposite effect. A breakdown below support around $1.38-$1.40 could swiftly accelerate downside volatility as trapped longs unwind positions, because the range has gotten so tight.
Positioning is another crucial element. The sentiment of the cryptocurrency market as a whole, ETF speculation, and regulatory headlines continue to have a significant impact on $XRP. Technical breakouts are frequently amplified once the price exits consolidation ranges due to external narrative pressure.
Dogecoin's recovery region
After effectively emerging from a protracted accumulation phase earlier this quarter, Dogecoin is still constructing one of its strongest technical structures in months. The meme coin has gradually moved into a more positive market structure, with higher lows, better momentum, and stronger support levels after a violent multi-month decline that pulled $DOGE from the $0.30 region toward lows close to $0.08.
According to the most recent chart, $DOGE is trying to stabilize above the psychologically significant $0.11 zone while holding above both the 20-day and 50-day moving averages. This is significant since Dogecoin traded below key trend indicators for the majority of the previous cycle, with each rally being swiftly rejected. Instead of plunging back under those levels right away, the price is now starting to consolidate above them.
The breakout above the declining trend structure that dominated price action through late 2024 and early 2025 was one of the most obvious bullish signals. $DOGE has continuously created higher lows since regaining support in the $0.09–0.10 range, indicating that buyers are progressively gaining control of momentum.
The trend reversal thesis is further supported by volume behavior. The current move attracted more trading activity, particularly during the breakout above resistance near $0.105, whereas previous attempts at recovery had little participation and quickly faded. Rather than a transient short squeeze, increased volume during upward continuation typically indicates stronger conviction from market participants.
Momentum metrics are still positive. Without going into extremely overbought conditions, the RSI rose into bullish territory close to the mid-60s, providing opportunity for further growth if overall market sentiment stays positive. Short-term cooling, however, is conceivable following the recent steep increase.
Near $0.12, which is close to the 200-day moving average, is the next significant resistance area. Because $DOGE hasn't consistently traded above its long-term trend indicator for a long time, that level is crucial. A clear breakout there might greatly boost the bullish case.
Toncoin's last resort
After an incredible breakout rally abruptly lost steam close to the $3 mark, Toncoin is getting close to one of the most crucial technical turning points in its recent comeback. TON surged higher in early May after weeks of quiet accumulation, cutting through all of the major moving averages and igniting a huge volume expansion that momentarily brought the price close to $2.9.
However, the market is now confronted with a much more challenging question: can TON genuinely maintain the psychologically significant $2 support zone? As of right now, that level seems to be the asset's lifeline.
Following its vertical breakout spike, the chart depicts TON quickly retracing. The speed of the correction is important because it indicates whether buyers are still actively defending higher prices or are just taking profits following a speculative surge, even though sharp pullbacks following parabolic moves are common. Thus far, TON has been able to hold above the 200-day moving average at $1.75 while stabilizing slightly below the $2 area. In terms of structure, that is crucial.
Prior to the breakout, TON gradually built a rounded base around $1.20-1.40 while spending months stuck beneath long-term trend resistance. The first significant bullish change in trend behavior since the start of the protracted decline was the recovery of the 200-day MA.
Volume also conveys a compelling narrative. There was a lot of participation in the breakout candle, indicating that the move wasn't totally fake or devoid of liquidity. However, a significant amount of speculative capital left the market close to local highs during the subsequent selloff, which also produced elevated volume.
In technical terms, the primary support cluster is now the $1.90–2.00 range. The market may attempt another continuation move later this quarter if buyers are successful in defending that area and TON begins to consolidate sideways rather than plummet lower. The bullish case would be greatly strengthened by a strong consolidation above the previous breakout resistance.
Momentum indicators have already significantly decreased. During the breakout, RSI momentarily entered extremely overbought territory, but it has since returned to neutral levels. This lowers the risk of overheating, but it also means that TON no longer has the explosive momentum to raise prices on its own.
The risk arises if TON loses the $1.90 area in a significant way. In that case, the market might swiftly retreat toward the 200-day moving average and possibly return to the $1.70 region where the breakout first picked up speed.

