


 14
14
Celestia [$TIA] climbed 10.28% in 24 hours while trading volume surged 55.86% to $88.62 million, signaling renewed speculative demand across the market.
The rally emerged after $TIA spent months trading within a compressed consolidation structure near lower support zones.
Buyers regained control once price reclaimed the $0.45 region, which previously acted as a strong resistance barrier.
Market capitalization also increased 10.48% to $453.2 million, reflecting broader capital inflows into the asset.
However, the recovery did not rely solely on price appreciation. Rising trading activity showed that participation had expanded significantly during the breakout phase.
As volatility returned, traders increasingly positioned around $TIA’s strengthening structure, raising expectations for additional upside continuation.
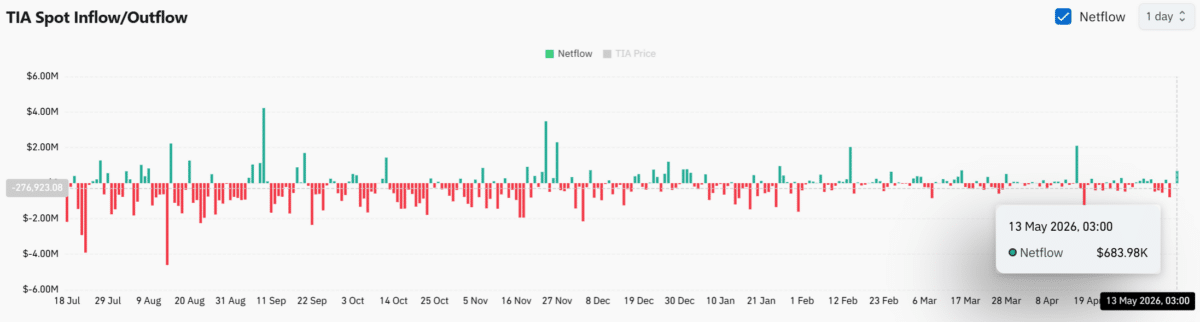
Spot flows shifted back positive
Spot market behavior strengthened after Netflows turned positive with over $683.98K entering exchanges on the 13th of May. The inflow spike followed several weeks where outflows frequently dominated activity across the market.
Buyers appeared increasingly active once $TIA reclaimed higher resistance zones above $0.45.
Exchange inflows often reflect rising positioning activity because traders move tokens toward platforms during periods of elevated volatility and speculation.
Nevertheless, broader flow behavior remained relatively balanced compared to previous aggressive distribution phases.
Several historical inflow spikes had previously triggered temporary rallies before fading rapidly.
This time, however, $TIA maintained strength while inflows accelerated, suggesting traders had sustained bullish participation instead of immediate profit-taking.
If inflows continued supporting price action, $TIA could preserve upward pressure toward higher supply zones.
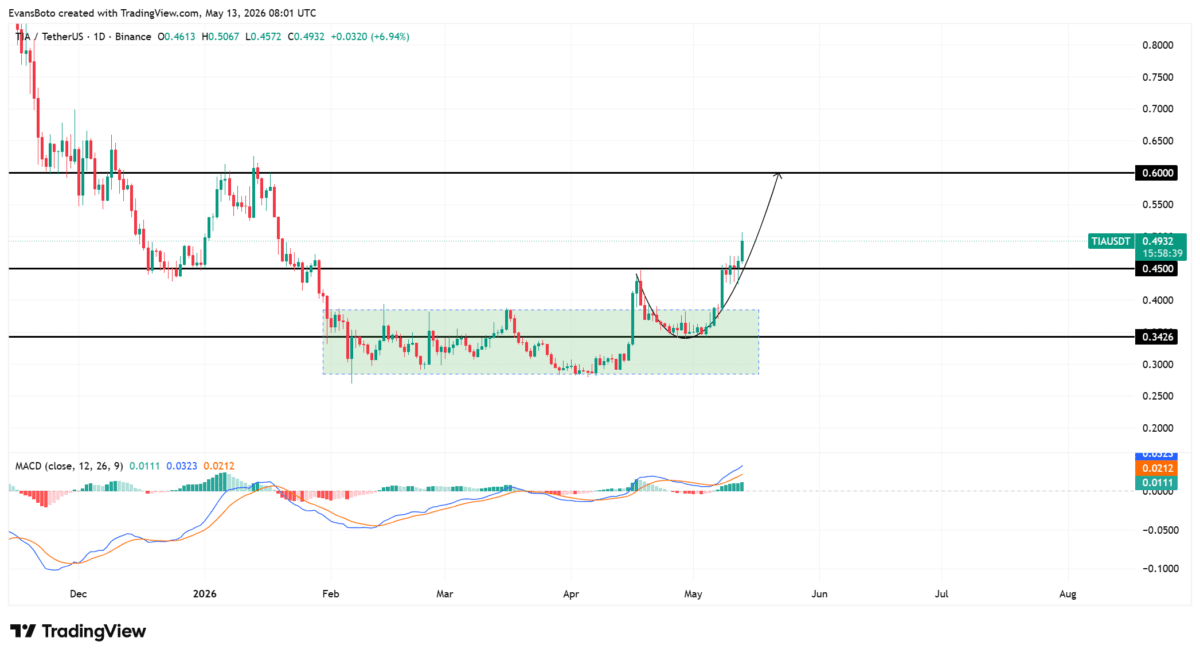
Breakout Structure Targeted $0.60
$TIA broke above the critical $0.45 resistance after spending months consolidating between the $0.28 and $0.38 range. The breakout followed a rounded recovery structure that gradually strengthened throughout April and early May.
Buyers repeatedly defended the $0.3426 support zone before reclaiming higher resistance levels.
The current structure showed improving bullish control as candles continued closing above former breakout regions.
In addition, the chart projected a possible continuation toward the $0.60 resistance zone if buyers maintained support above $0.45.
Earlier rallies had failed near similar levels after sellers regained dominance quickly.
This time, however, price action sustained a stronger follow-through while higher lows continued forming beneath resistance.
If $TIA preserved this breakout structure, buyers could continue targeting the next major supply area.
MACD indicators strengthened further as the bullish crossover expanded above the neutral zone. Green histogram bars also continued increasing, showing that buying pressure intensified during the latest recovery phase.
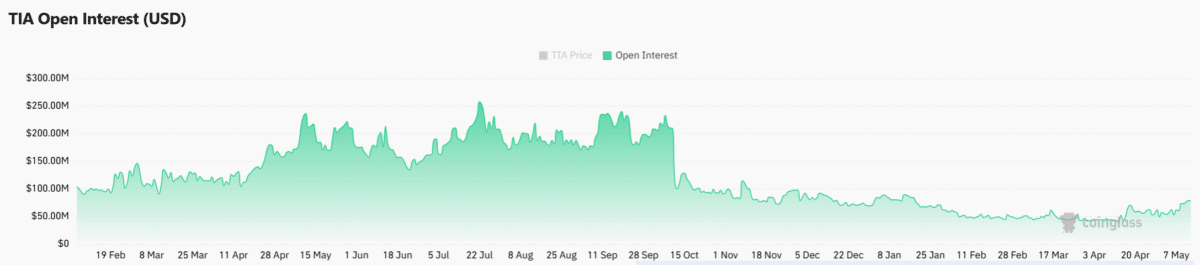
Open Interest climbed alongside price
Open Interest climbed 8.63% to $84.46 million as leveraged traders increasingly positioned around $TIA’s breakout structure.
The rise in derivatives exposure aligned with strengthening spot demand and expanding technical structure across the daily timeframe.
Traders appeared increasingly confident after $TIA reclaimed resistance zones that previously limited upside continuation.
Rising Open Interest alongside price expansion often reflects fresh positioning entering the market rather than traders closing exposure.
However, elevated derivatives activity also increased the probability of volatility if buyers lost control near resistance.
Previous Open Interest spikes had occasionally preceded liquidation-driven pullbacks after traders became overcrowded.
Current positioning nevertheless remained supported by rising volume and improving structure.
In conclusion, $TIA has shown a strengthening bullish structure after reclaiming key resistance alongside rising volume, positive Netflows, and expanding Open Interest.
Buyers maintained control above the $0.45 breakout region while MACD indicators continued supporting bullish continuation.
If current demand remained stable near reclaimed support, $TIA could continue advancing toward the $0.60 resistance zone during the next recovery phase.
Final Summary
- $TIA reclaimed key resistance as buyers increased exposure across spot and derivatives markets.
- Bullish MACD structure and rising Open Interest continued supporting $TIA’s breakout continuation setup.

