

 3
3
Solana is holding a key short-term support zone while its weekly chart points to a larger breakout setup.
The next move depends on whether $SOL protects the $92 to $94 area and keeps the higher-low structure active.
Solana Breakout Setup Targets $1,000 as $SOL Holds Long-Term Base
Solana is showing a long-term breakout setup after holding a broad support base, according to a chart shared by CryptoCurb on X.
The weekly $SOL chart compares the current structure with an earlier setup from 2021. In both cases, Solana moved sideways near support, formed a descending resistance line, then broke out from the compression zone.
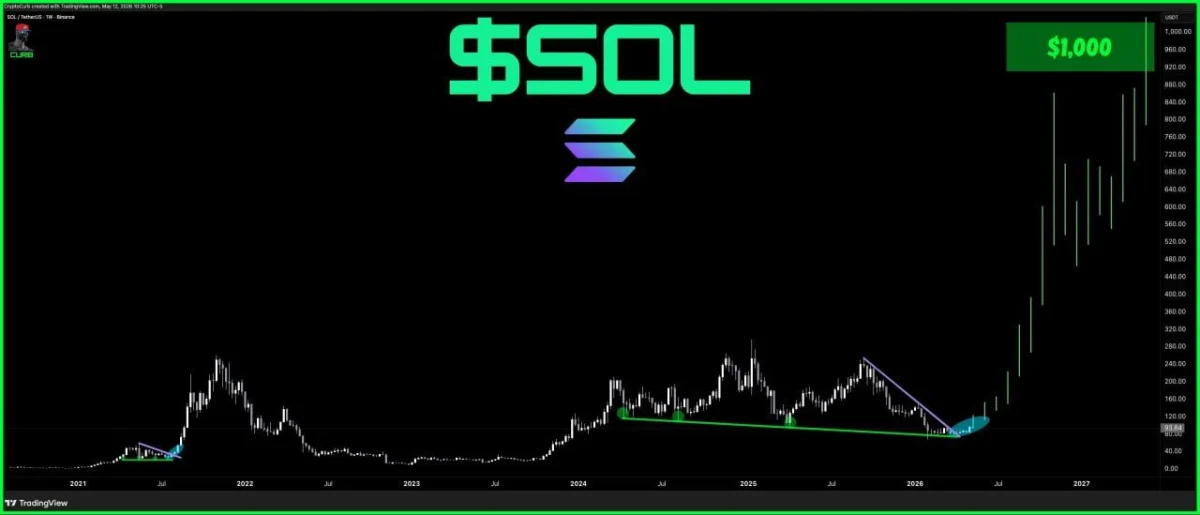
Solana Weekly Chart. Source: CryptoCurb on X
The latest chart shows $SOL holding a long green support line after several reactions from the same area. This suggests buyers have defended the broader base across multiple pullbacks.
A purple descending trendline marks the latest correction. $SOL has now moved above that line, which points to a possible breakout from the downtrend that started after the 2025 high.
CryptoCurb said Solana is “going to $1,000,” and the chart marks that level as the upside target. The projection shows a steep rally path toward the upper range through 2026 and 2027.
However, the move is not confirmed by the chart alone. $SOL still needs stronger continuation above the breakout zone to support the $1,000 target.
If $SOL holds above the former descending trendline, the bullish setup remains active. If price falls back below the breakout area, the structure weakens and focus shifts back to the long-term support base.
For now, the Solana chart shows a breakout attempt from a multi-month base, with the $1,000 level marked as the long-term target.
Solana Tests $92 Support as $SOL Bulls Look for Higher Low
Solana is testing the $92 to $94 support block after sweeping local highs, according to a chart shared by crypto analyst Sebi on X.
The 4-hour $SOL chart shows price pulling back into a green support zone after a sharp move above the previous range. This area now matters because it could decide whether Solana forms a higher low and keeps short-term momentum active.
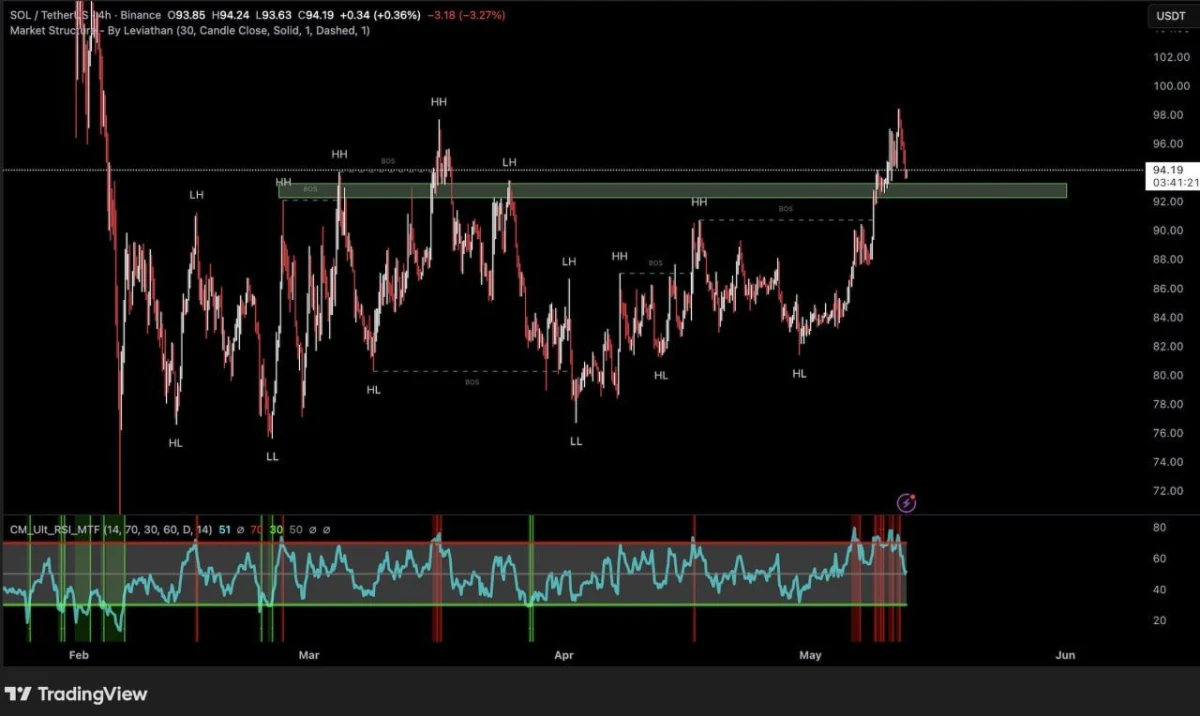
Solana 4-Hour Chart. Source: Sebi on X
Sebi said the $92 to $94 block is the primary zone for $SOL to print a quick higher low. If buyers defend that area, the chart points to another push toward the upper range.
The structure still shows higher lows after the April bottom. $SOL moved from lower levels near $76, then built a recovery through the $82, $86, and $90 zones before breaking above nearby resistance.
However, the chart also shows pressure after the latest high sweep. The RSI panel at the bottom sits near the upper range, which suggests the move became stretched before the pullback.
If $SOL loses the $92 level, Sebi said it would not mark a trend change. Instead, the chart points to a deeper shakeout toward the $86 to $88 structural area.
That lower zone could become the next base if the current support block fails. For now, Solana remains in a bullish structure, but the $92 to $94 zone is the key short-term test.
