

The cryptocurrency is currently trading around $95, with intraday movement between $93.16 and $96.78, showing a tight but active consolidation zone just below a major psychological level.
Notably, $SOL has posted a 7-day gain of roughly 12% and a 30-day increase of about 13%, reflecting sustained momentum rather than a short-lived spike.
However, despite this short-term strength, Solana is still down around 45% over the past year, highlighting that the broader recovery is still in progress.
Institutional demand and market rotation support the rally
A key driver behind Solana’s recent strength has been renewed institutional participation.
On-chain activity shows a previously inactive wallet re-entering the market and purchasing 67,648 $SOL worth approximately $6.23 million over a two-day period in early May.
This type of movement is typically associated with larger investors repositioning rather than retail speculation.
At the same time, US-listed spot Solana exchange-traded funds (ETFs) last week recorded five consecutive days of net inflows according to Coinglass data, suggesting that capital allocators are beginning to build exposure to the asset again.
This has coincided with Solana outperforming Bitcoin on several trading days, with $SOL rising about 1.8% while Bitcoin remained flat during the same period.
Retail participation has also increased sharply.
Activity across Solana-based decentralised exchanges has surged due to a wave of meme coin trading, with tokens such as $TROLL and $AURA posting triple-digit percentage gains.
This has contributed to higher network usage and trading volumes, reinforcing momentum on the chain.
Together, institutional inflows and retail speculation are creating a dual-engine effect, where both large-scale capital and high-frequency trading activity are supporting price stability near resistance levels.
Technical analysis shows compression below $100
From a technical standpoint, Solana is now trading in a narrow band between $94 and $97, directly beneath a key resistance area.
The most important level on the chart is $97.56, which has been identified as the first major breakout trigger.
A daily close above this level would open the door for a potential continuation toward higher resistance zones.
If momentum continues beyond $97.56, the next projected targets are $100 to $102, followed by a longer-term resistance zone near $127.75.
This creates a clear multi-stage structure where $100 acts as both a psychological and technical barrier.
On the downside, immediate support sits at $94, followed by a stronger support cluster between $92 and $93.
A deeper breakdown below this range would weaken the current structure and expose the price to a potential move back toward $87.16, which analysts consider the main invalidation level for the ongoing bullish setup.
Further still, momentum indicators are showing mixed conditions.
While the broader trend remains bullish, supported with Solana trading above its 10-day, 20-day, 50-day, and 100-day exponential moving averages, the 14-day RSI stands at 66.82, pulling back from an overbought region.
This means that Solana could be in a short-term consolidation or minor pullback before a continuation of the previous bull run.
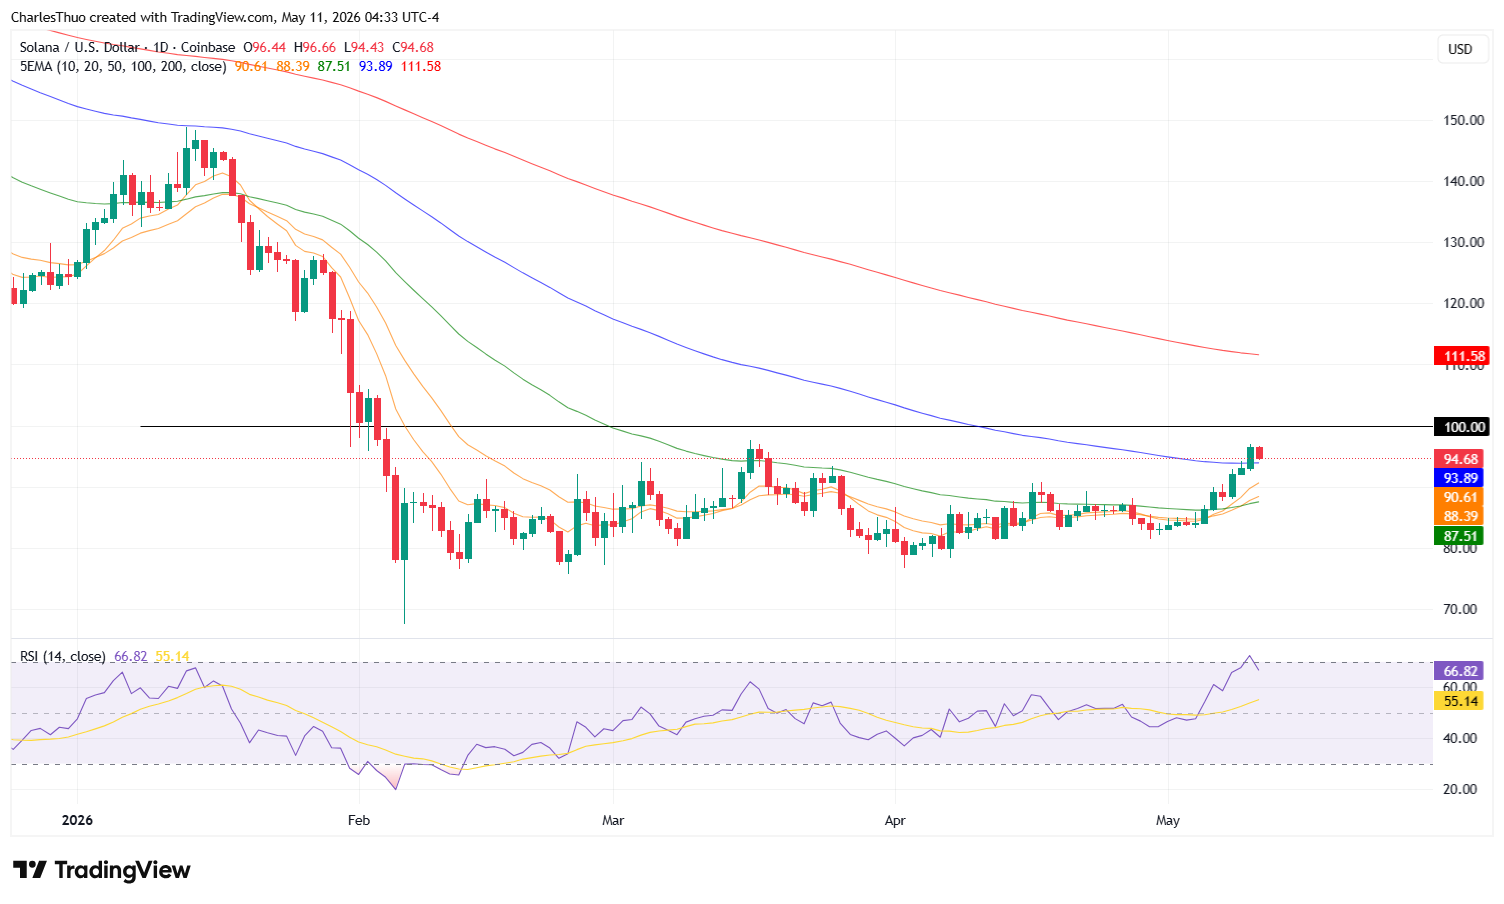
In addition, the price is still below the 200-day EMA, indicating that the long-term trend has not fully confirmed a complete reversal.
Historically, Solana has shown extended cycles of sharp expansion and deep retracement.
After reaching its previous all-time high of $259.44 in November 2021, the asset fell to around $9.85 in December 2022, before entering its current recovery cycle.
This long-term context highlights that while the current trend is improving, it is still operating within a broader rebuilding phase.
