


 12
12
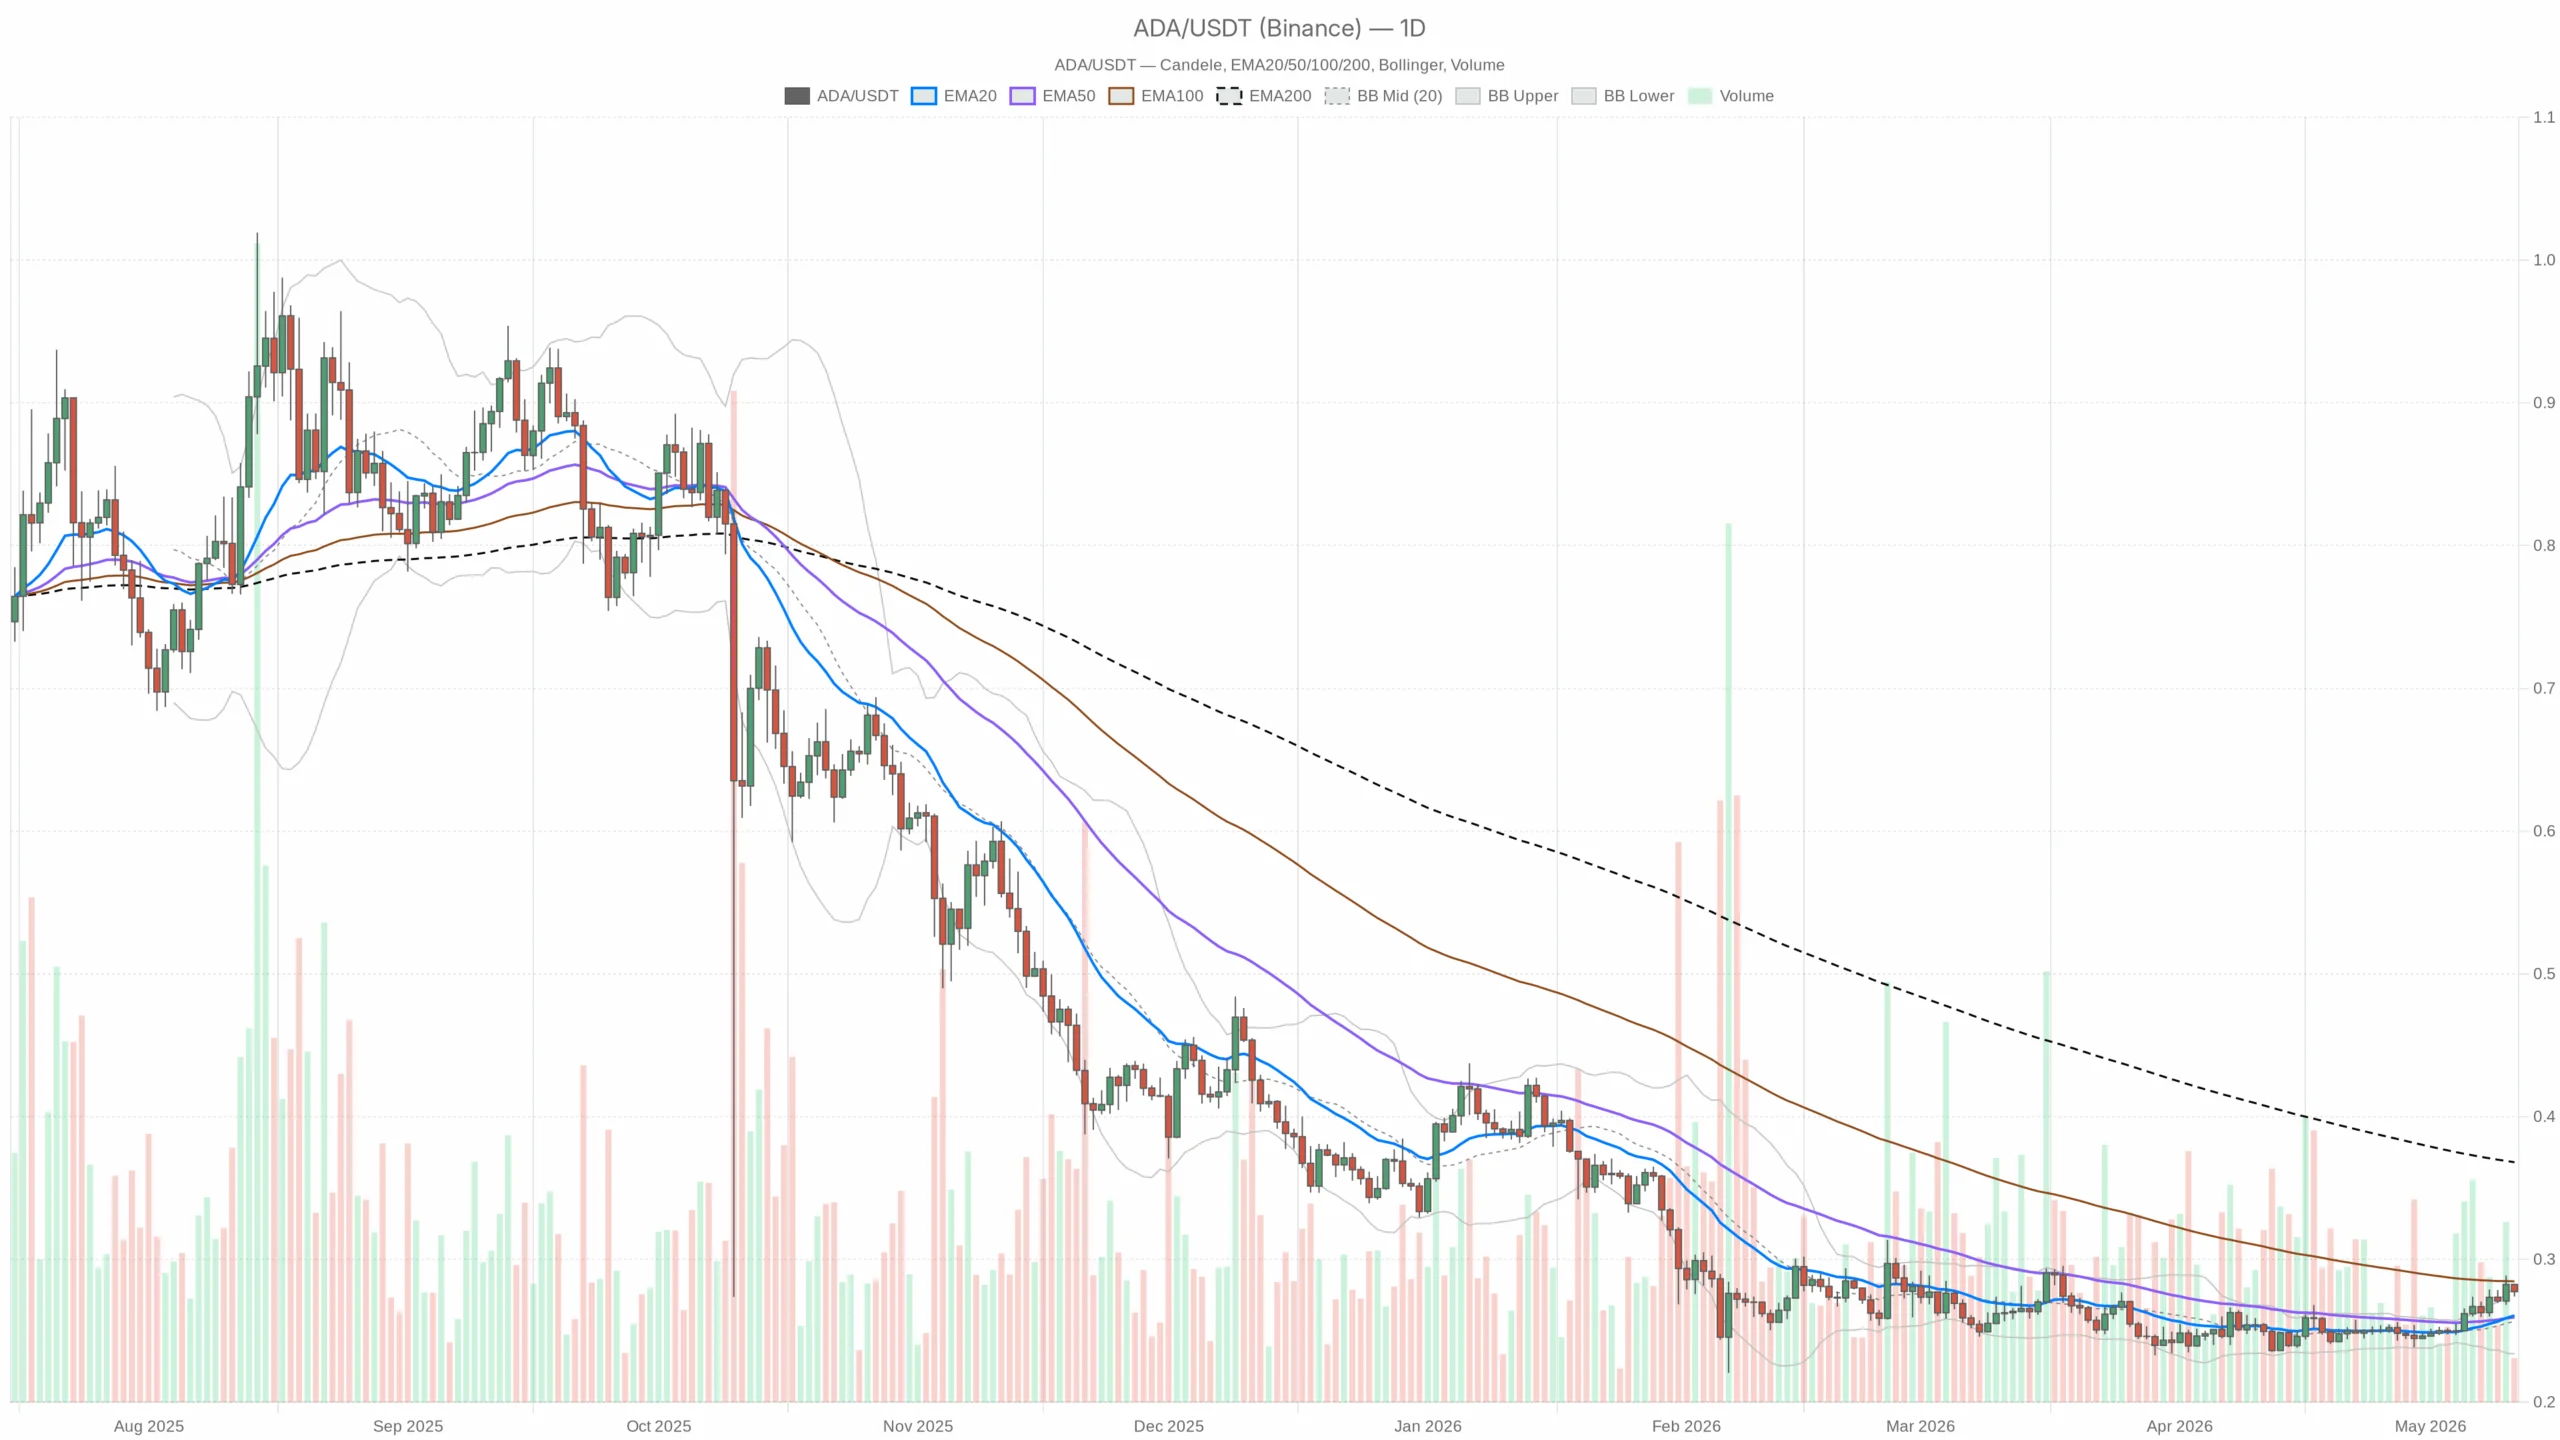
$ADA is sitting at a technically important point, and the Cardano crypto price still looks constructive on the daily chart even as intraday momentum has faded near the $0.28 pivot zone.
Main scenario: Neutral with a mild bullish tilt
Based on the daily timeframe, the main scenario is neutral-to-bullish. $ADA has reclaimed its short and medium moving averages and is holding near recent highs. Even so, price is still well below the 200-day EMA at $0.37. That is a reminder this is not a full macro trend reversal yet. It is more of a recovery phase pressing into overhead resistance.
The key tension is simple: the daily chart says buyers still control the recent swing, while the 1-hour and 15-minute charts show momentum has flattened. That usually leads to one of two outcomes: a fresh breakout attempt after consolidation, or a short-term pullback that tests whether dip buyers are real.
Daily chart: constructive structure, but not a clean breakout
On the daily timeframe, $ADA is trading at $0.28, above the 20-day EMA at $0.26 and the 50-day EMA at $0.26, but still below the 200-day EMA at $0.37. That alignment supports the view that short-term trend conditions have improved meaningfully from prior weakness. However, the longer-term structure remains unfinished.
The daily RSI is 64.37, which is firm without being fully stretched. It shows buying pressure has been solid, but not yet at the kind of extreme that automatically kills upside. Therefore, another push higher remains possible, although $ADA is no longer deeply undervalued on momentum terms.
Daily MACD is slightly positive, with the line at 0.01, the signal near 0, and the histogram flat. The important detail is not strong acceleration, but the fact that momentum remains positive while losing sharpness. That usually fits a market that has already bounced and is now deciding whether it has enough fuel for continuation.
Bollinger Bands on the daily chart show a mid-band at $0.26, an upper band at $0.28, and a lower band at $0.23. Price is sitting right at the upper band. That is a sign of strength, but also a warning that $ADA is trading at the edge of its recent range and may need either a breakout catalyst or a cooling-off phase.
The daily ATR is $0.01, which points to moderate volatility at this price level. In practice, $ADA is moving enough to matter, but this is not a disorderly market. For now, it looks more like controlled expansion than panic or euphoric chasing.
Daily pivot levels are tightly clustered, with the pivot point at $0.28, R1 at $0.28, and S1 at $0.27. That tells you the market is compressed around a decision area. If the Cardano crypto price holds above $0.28, buyers can try to force continuation; lose $0.27 and the near-term tone weakens quickly.
1-hour chart: confirmation is missing
The 1-hour chart is where the bullish daily story starts to wobble. $ADA is at $0.28, with the 20-hour EMA and 50-hour EMA both at $0.28, and the 200-hour EMA at $0.27. Price is still marginally above the longer intraday trend line, but the shorter averages have gone flat.
The hourly RSI is 49.2, almost perfectly neutral. Buyers are no longer pressing, but sellers have not taken control either. This is classic equilibrium, and equilibrium near resistance often needs a catalyst to break one way or the other.
Hourly MACD is essentially flat across the board. As a result, traders looking for clean trend continuation do not have much confirmation from this timeframe right now.
Hourly Bollinger Bands sit between $0.27 and $0.29, with the mid-line at $0.28, and price is dead center. That is the signature of compression, not expansion. Usually, the next meaningful move comes after this kind of squeeze, but direction still needs to be earned.
The hourly ATR is effectively flat, and pivot levels are clustered around $0.28. Therefore, the same message remains intact: $ADA is coiling, not trending, on the intraday chart.
15-minute chart: weak execution backdrop
The 15-minute chart is useful here only for execution context, and it is not especially supportive for immediate upside. Price is at $0.28, with the 20, 50, and 200 EMAs all sitting at $0.28. That is total short-term flattening, which usually means there is no edge in chasing price inside the current range.
The RSI at 43.39 leans mildly soft, while MACD is flat and Bollinger Bands are extremely compressed. In real trading terms, the market is dull at this horizon. Until volume and directional momentum return, the 15-minute chart is more useful for spotting failed breaks than for predicting trend.
Bullish scenario
The bullish case remains valid as long as $ADA holds above the daily support cluster around $0.27 and continues to defend the 20-day and 50-day EMAs near $0.26. If price can turn current compression into a clean break above $0.28 and start holding that level instead of merely tagging it, the market could extend the recovery leg.
What would strengthen the bullish view is simple: the 1-hour RSI needs to move back above neutral, MACD needs to turn decisively positive, and price needs to separate from the flat intraday averages rather than sit on them. Without that, the daily setup stays constructive but incomplete.
The bullish scenario is invalidated if $ADA loses $0.27 cleanly and then slips back toward $0.26 with the daily structure rolling over. A deeper failure below the 20-day and 50-day EMAs would suggest the recent upside was more rebound than trend change.
Bearish scenario
The bearish case is not the primary one on the daily chart, but it is credible because price is testing the upper edge of its recent range without strong intraday momentum. If $ADA fails to hold $0.28 and starts closing below $0.27, the market could mean-revert toward the daily mid-band and EMA support around $0.26.
If sellers manage to push price back below $0.26, the tone deteriorates much more seriously. At that point, the market would no longer be consolidating strength; it would be giving back reclaimed structure. Moreover, the bigger bearish overhang remains the 200-day EMA at $0.37, which shows the long-term trend is still not repaired.
The bearish view is invalidated if $ADA breaks and holds above $0.28 with hourly momentum expanding instead of fading. A successful breakout backed by stronger intraday participation would force the short side to step aside.
Positioning and risk
Right now, the Cardano crypto price is in a technically respectable place, but not in a clean trend-confirmation zone. The daily chart favors patience from bulls rather than blind aggression, while the lower timeframes argue against chasing strength before the market proves it can actually expand from this tight range.
This is the sort of environment where positioning matters more than conviction. Bitcoin dominance remains above 58%, and broader crypto market cap has barely moved over the last 24 hours. Therefore, altcoins like $ADA are not getting much help from risk appetite. Traders should watch whether $ADA turns $0.28 into support or slips back through $0.27 toward $0.26.
In summary, the setup remains constructive on the daily chart, but the lower timeframes are not confirming a clean continuation move. That keeps the outlook neutral with a mild bullish tilt, while the next move still needs confirmation rather than assumption.
