
Shiba Inu trades at $0.00000653 on May 11, one candle away from a resistance zone it has failed to break three times this year, as derivatives volume explodes 149% and the weekly burn rate quietly collapses 62% in the same week.
Shiba Inu Daily Chart: Resistance Test With EMAs Still Overhead
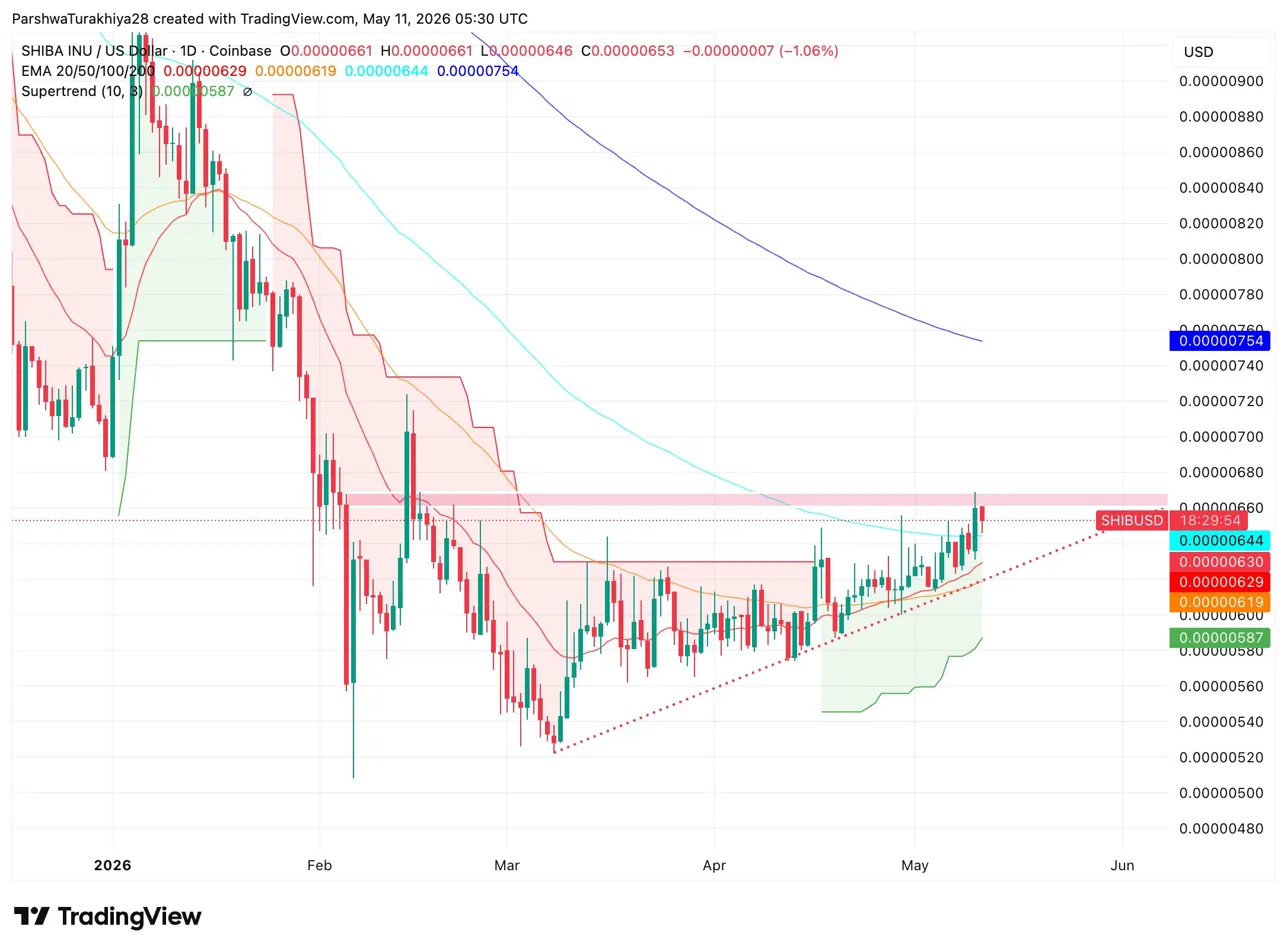
The daily chart shows $SHIB has recovered sharply from the February lows near $0.0000052, grinding higher inside an ascending channel since late March. The Supertrend indicator flipped bullish at $0.0000587 and has held below price through the entire recovery, a positive signal. Price is now pressing directly into the $0.0000660 to $0.0000668 resistance band, the same zone that rejected multiple breakout attempts earlier this year.
The EMA picture is mixed. The 20 EMA at $0.0000629 and 50 EMA at $0.0000619 are both below price and acting as support. The 100 EMA at $0.0000644 is right at current price, making it the immediate hurdle. The 200 EMA at $0.0000754 sits well above and marks the next major resistance after a clean break of the current zone.
$SHIB Key levels for May 11:
- Resistance: $0.0000660 to $0.0000668 zone, $0.0000754 (200 EMA)
- Support: $0.0000629 (20 EMA), $0.0000587 (Supertrend)
- Channel base: $0.0000580 to $0.0000600
$SHIB Derivatives: Volume Surge With a Long-Skewed Crowd
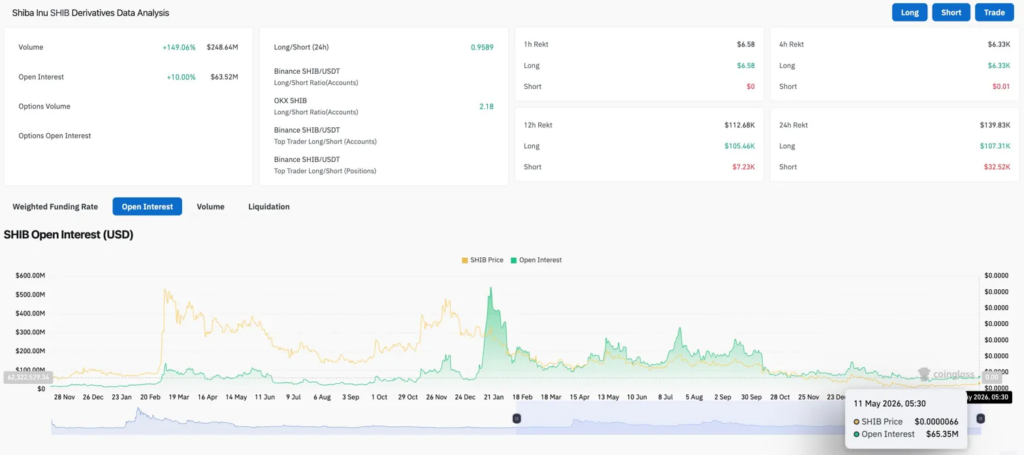
$SHIB derivatives jumped 149.06% to $248.64M while open interest climbed 10% to $63.52M. When both rise together, new positions are being built, not just recycled. The OKX long/short ratio at 2.18 shows aggressive long bias, while Binance top traders sit nearly neutral at 1.0033. That gap between retail conviction and professional positioning is worth noting.
Over 24 hours, $107.31K in longs were liquidated versus $32.52K in shorts. Both sides are getting hit, but longs are absorbing most of the damage pressing into ceiling. That is overleveraged positioning at resistance, not a healthy breakout setup.
Burn Rate Collapse Is the Chart No One Is Talking About
Burn activity peaked at 11.5M $SHIB on May 1 and fell off immediately, dropping below 2M by May 3 and never recovering. By May 8 the weekly rate was down 62.08%. At the time of writing, only 418 $SHIB burned in the last 24 minutes.
For a token where supply destruction is the primary long-term price argument, a 62% weekly decline directly at resistance is bad timing. It does not kill the trade, but it removes the one catalyst that would make a breakout here convincing.
Exchange Flows Show Sellers Still in Control
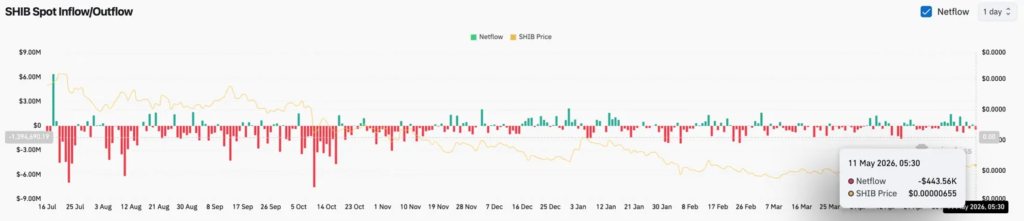
Meanwhile, spot netflow on $SHIB came in at negative $443.56K on May 11, continuing a pattern of net outflows from exchanges that has persisted since mid-2025.
Persistent negative netflow means more $SHIB is leaving exchanges than entering, which is typically a bullish signal as it reduces available sell-side supply.
$SHIB Price Prediction: Upside and Downside Levels for May 11
Upside: A daily close above $0.0000668 with sustained volume clears the resistance band and opens a run toward the 200 EMA at $0.0000754. If broader altseason conditions kick in and burn activity recovers, $0.0000800 becomes the extended target.
Downside: Rejection at $0.0000660 with overleveraged longs unwinding pushes price back to the 20 EMA at $0.0000629 fast. Losing the Supertrend at $0.0000587 on a daily close would signal the recovery channel has broken and put $0.0000520 back in view.