


 3
3
The market is currently exhibiting a textbook rotation phase.
On the technical side, Bitcoin dominance ($BTC.D) has logged four straight days of downside pressure after its early May breakout to 61.2%. At the same time, the Altcoin Season Index has jumped by more than 10 points in less than 24 hours, reinforcing a classic $BTC-to-altcoin rotation setup.
Historically, however, altcoin rallies rarely sustain momentum unless Ethereum [$ETH], the largest altcoin, starts gaining strength against Bitcoin [$BTC], allowing deeper capital to flow across the broader altcoin market.
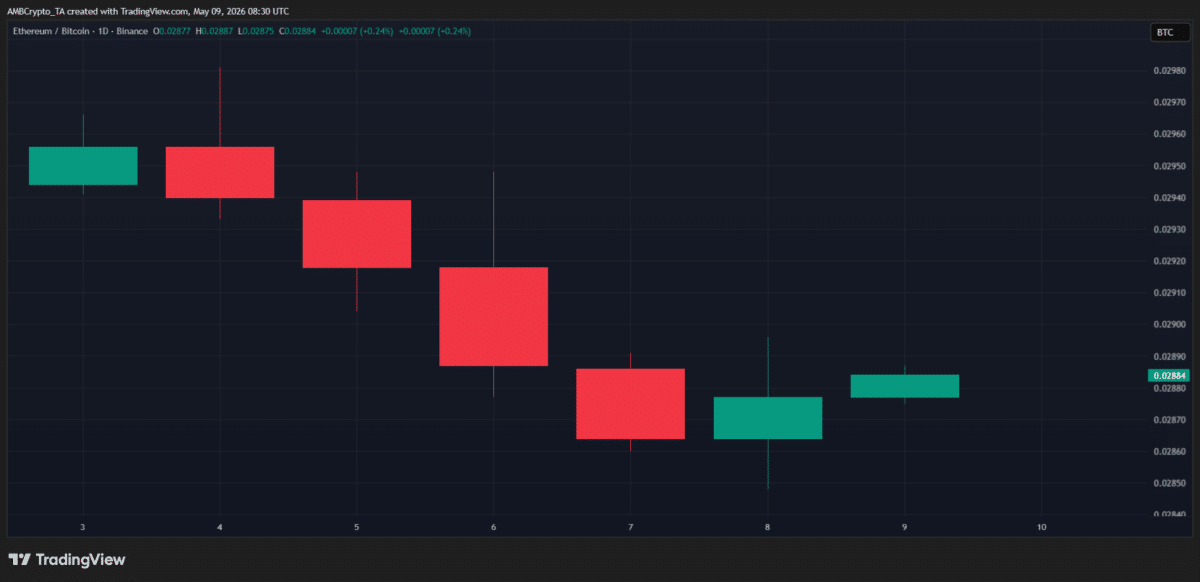
As the chart below shows, the $ETH/$BTC ratio has rebounded around 0.7% after four consecutive weeks of decline. This could be an early sign that rotation might be expanding beyond Bitcoin.
In short, several signals may be lining up for the market to start speculating on an altcoin rally.
That said, momentum remains the key variable. During the previous February-April cycle, the $ETH/$BTC ratio jumped by nearly 15%, pushing the Altcoin Season Index up more than 40% before topping near 55. This aligned with the $BTC.D running into resistance around the 60%-level, creating a similar rotation narrative.
And yet, despite the improving structure, the setup never evolved into a full-blown altcoin cycle. The Altcoin Season Index failed to break above the 75-threshold typically required to confirm broad, market-wide altcoin expansion.
This raises the key question – Is the market simply entering another short-lived rotation phase, or is this setup fundamentally different?
Falling $USDT dominance as a key liquidity driver behind altcoin rotation
The ongoing altcoin rotation isn’t happening in isolation.
Instead, it is moving in tandem with $USDT dominance, with the same down 2.7% over the week, breaking below the critical early-February support level of 7%. Declining $USDT dominance typically signals liquidity flowing out of risk assets, which aligns with $BTC.D hitting resistance as well. Together, these observations imply that investors have been expressing hesitation in allocating further into Bitcoin and may be gradually rotating capital elsewhere.
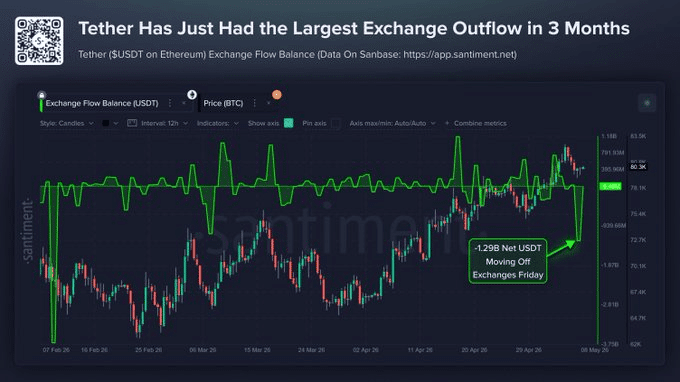
Notably, on-chain data further seemed to support this trend. At the time of writing, $USDT flows had just recorded their largest exchange outflow in roughly three months, with -$1.29 billion in net $USDT leaving exchanges on 08 May.
Typically, this is a bearish signal. However, when combined with a rising $ETH/$BTC ratio, it means that capital may be increasingly rotating into altcoins rather than exiting risk assets entirely.
Naturally, this makes the decline in $USDT dominance a key distinguishing factor in the current cycle.
If this trend holds, the rebound in the Altcoin Season Index, after retracing back to mid-July 2025 levels, could reflect potential exhaustion in altcoin selling pressure. Combined with the $ETH/$BTC gaining strength, the broader altcoin market may begin to follow suit, making this a key setup to watch for divergence from the February-April altcoin rally structure.
Final Summary
- A hike in $ETH/$BTC and the Altcoin Season Index hinted at early capital rotation.
- $USDT dominance’s decline with large outflows seemed to support altcoin strength too.