
Market data indicates that $XRP may now be sitting on a critical level that usually leads to strong rebounds.
According to Mikkybull, a prominent market watcher, this imminent rebound could push the $XRP price to $12, marking a new all-time high for the asset. For perspective, this would represent a 769% increase from $XRP’s current price.
Key Points.
- Market data indicates that $XRP sits on a critical level that usually triggers strong rebounds.
- This level represents the lower trendline of a multi-year ascending parallel channel.
- The last time $XRP retested this level in November 2024, it rallied 580% in two months.
- When $XRP dropped to this trendline in 2017, the rally that followed led to a 65,900% increase.
- $XRP could target $12 this time if the recovery pattern plays out again.
$XRP Slips Amid Market Pullback
Mikkybull shared his latest insights on the back of the recent market-wide pullback that has since dealt a blow to asset prices. Specifically, after reaching $80,000 earlier this month for the first time since January, BTC claimed $82,000 but has since pulled back to $79,700.
Altcoins followed suit, with $XRP dropping from a high of $1.4567 to the current price around $1.38, effectively losing the $1.40 mark. This drop followed a 2.66% decline on Thursday, May 7, representing $XRP’s largest intraday drop in nearly three weeks.
$XRP Remains in a Critical Position
Despite the recent decline, Mikkybull pointed out that $XRP remains at a critical level that has often led to massive upside for the cryptocurrency. For context, this level represents the lower trendline of a multi-year ascending channel that has dictated $XRP’s price action since inception.
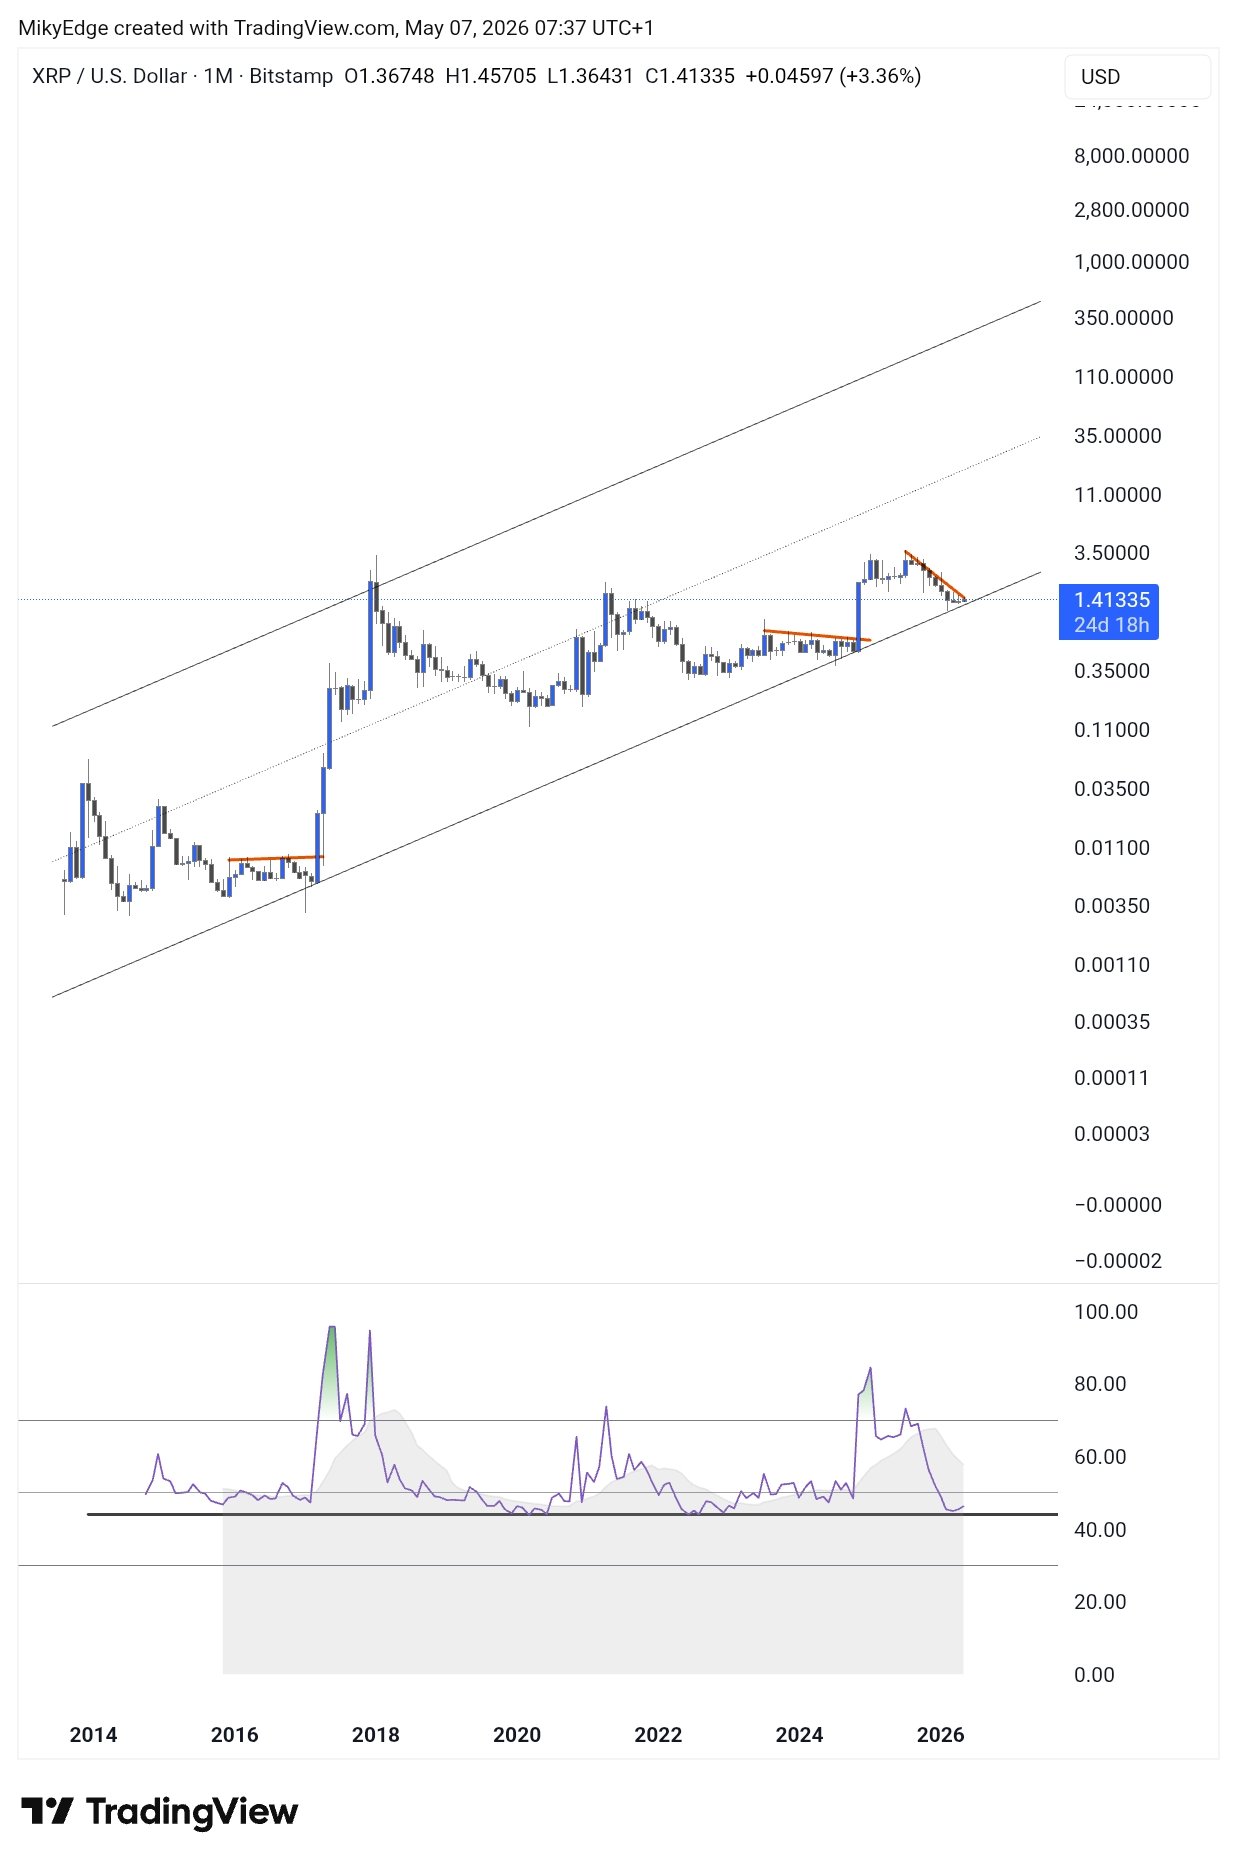
Notably, this channel features three trendlines: the lower, middle, and upper, all ascending in a parallel manner. The analyst calls the lower trendline a “critical level” because retesting it has preceded most of $XRP’s explosive rallies. $XRP has only dropped to this critical level twice in its history, with the latest retest marking the third one.
Historical Context
The first time $XRP dropped toward the lower level was during the 2017 market cycle, when prices declined to a low of $0.0050 in February of that year. After retesting the lower ascending trendline, the $XRP price spiked, eventually reaching $3.31 by January 2018. This marked a 65,900% rise within a year.
$XRP dropped to retest the trendline again in November 2024, as the price declined toward $0.5. From here, $XRP staged another rebound push, spurred by Donald Trump’s election victory. The ensuing rally pushed $XRP’s price from $0.5 in November 2024 to $3.4 by January 2025, representing a 580% rise in three months.
$XRP Targets $12
Considering the historical context, Mikkybull suggested that $XRP could follow a similar upward push from the current position. Data from his chart shows that $XRP has also been trading below a descending trendline within the channel since it dropped from the $3.6 all-time high in January, indicating the ongoing downtrend.
For $XRP to replicate the previous uptrends, it must first break above this descending trendline. According to Mikkybull, $XRP could target the $12 price level during the uptrend, which represents a midpoint value. For perspective, $XRP would have to rise 769% to reach this level.
Complementing this outlook, market analyst Myles G also pointed out that $XRP has continued to trade within a multi-month symmetrical triangle throughout this year. According to him, the token is “about to launch,” alluding to a potential breakout above the triangle. This may kickstart $XRP’s uptrend from the lower ascending trendline identified by Mikkybull.
$XRP is about to launch pic.twitter.com/ho5jSpCQiJ
— Myles G Investments (@MylesGinvest) May 7, 2026