

 2
2
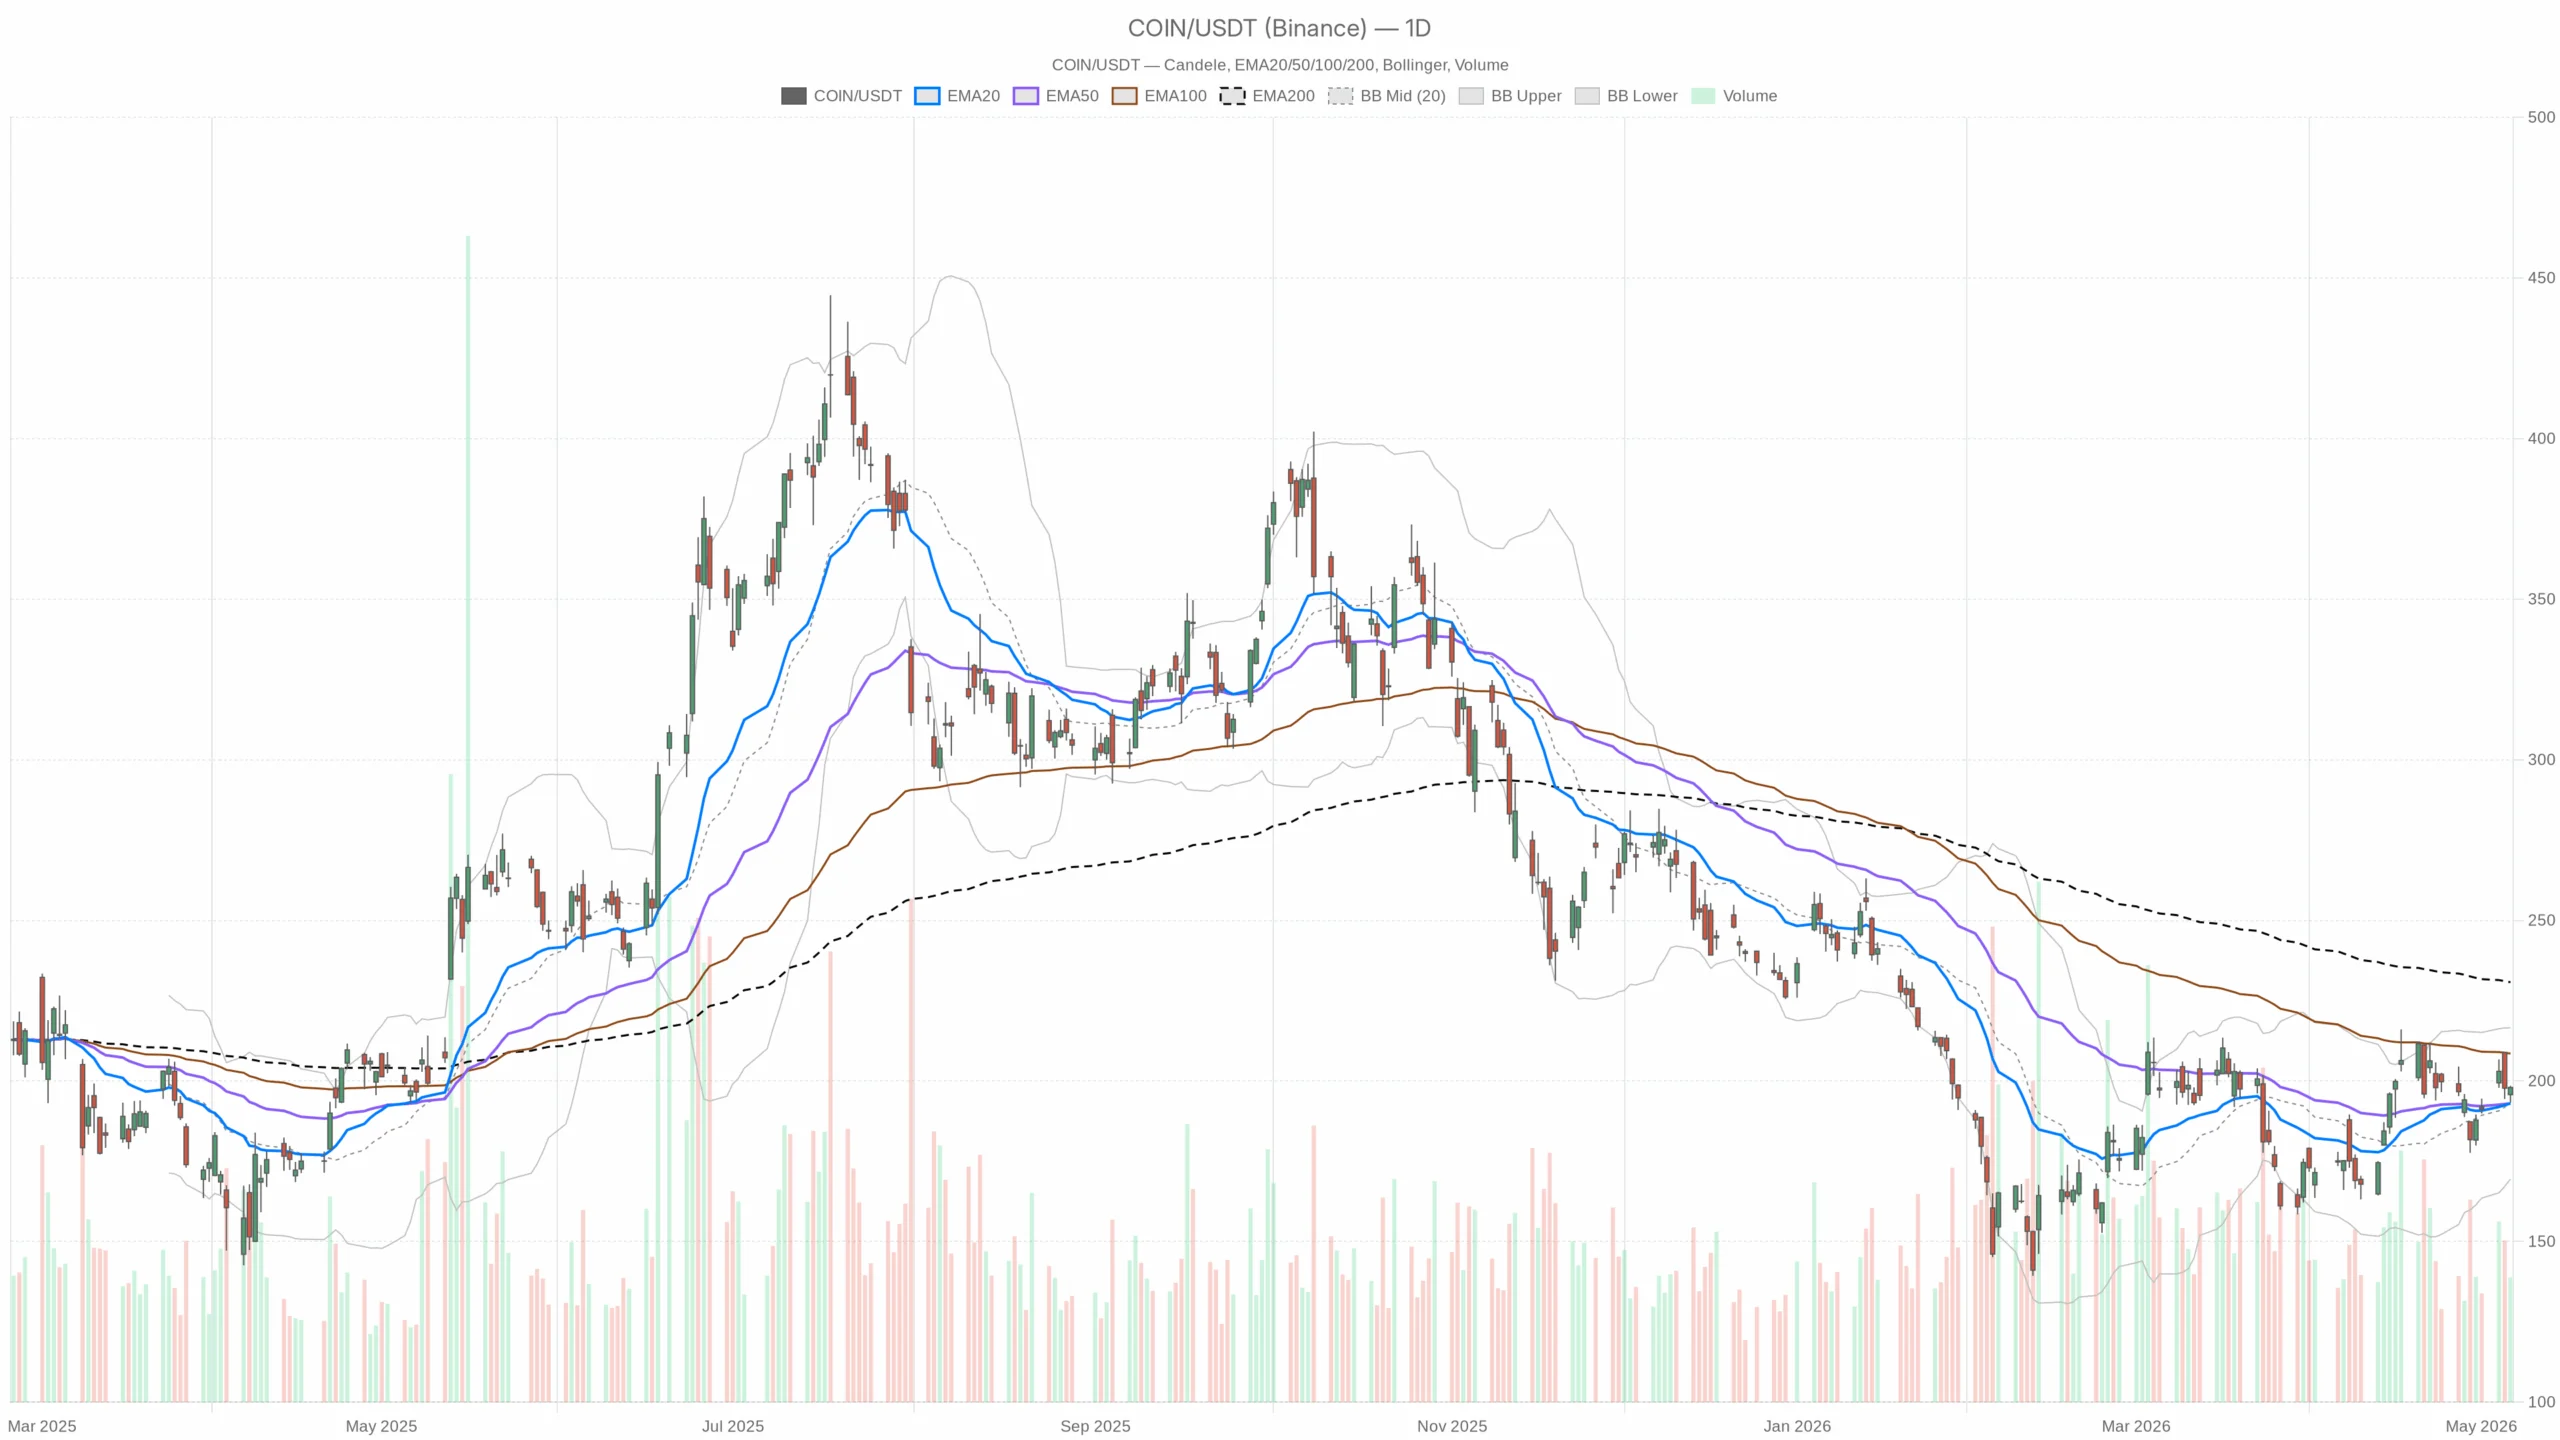
Coinbase Stock is approaching earnings with a cautiously constructive tone, but the setup still lacks the conviction of a clean breakout. COIN is holding above key short-term averages, yet it remains below its 200-day trend line and close to a technical decision zone.
Coinbase Stock Daily Chart Keeps a Constructive, Incomplete Recovery
On the daily chart, COIN closed at 197.96. That is above both the 20-day EMA at 192.99 and the 50-day EMA at 193.02. As a result, the near-term structure remains stable and buyers have regained control of the short-term trend.
However, Coinbase Stock is still well below the 200-day EMA at 230.73. Therefore, the broader recovery remains incomplete and the larger trend has not fully turned.
The daily bias is neutral to slightly bullish. Daily RSI stands at 53.85, which signals balanced momentum with a mild positive tilt rather than an overextended move. MACD is also marginally positive, with the line at 2.9 above the signal at 2.73 and a histogram of 0.17. Overall, the daily chart is constructive, though far from decisive.
Decision Zone Near Daily Pivot and Resistance
Notably, price is trading near the daily pivot at 196.57 and just below first resistance at 199.89. That places COIN close to an important technical decision zone. A push through 199.89 would strengthen the case for further upside. On the other hand, a slip back below support at 194.64 would weaken the recent recovery attempt.
Daily Bollinger Bands also place Coinbase Stock near the middle of its volatility envelope. The midpoint sits at 192.98, while the upper band is at 216.54 and the lower band at 169.42. This suggests there is room in either direction, and price is not yet stretched on the daily timeframe.
Volatility and Earnings Keep COIN in Event-Driven Mode
Daily ATR is 11.8, which is elevated enough to underline that COIN remains a high-beta name even before earnings. That matters more now because the backdrop is event-driven.
Coinbase is due to report Q1 earnings after the bell on Thursday. Meanwhile, options markets are pricing roughly an 8.5% to 9% post-earnings move. The company has also announced job cuts, which adds another layer of uncertainty around sentiment and forward expectations. In short, the market is not just trading the chart. It is trading an imminent catalyst.
Coinbase Stock Hourly Chart Supports the Trend but Warns on Momentum
On the hourly chart, the message is supportive but less clean than the daily picture. COIN closed at 197.88, above the 20-hour EMA at 196.55, the 50-hour EMA at 195.43, and the 200-hour EMA at 191.96. That confirms the shorter-term trend is still tilted upward.
Hourly RSI at 54.45 also shows buyers retain some control. However, momentum is not especially strong.
Hourly MACD Shows Fading Urgency
Hourly MACD complicates the bullish case. The MACD line is 0.51, below the signal line at 0.91, with a negative histogram of -0.4. That points to slowing intraday momentum even as price remains above key moving averages.
So, the hourly chart confirms the trend structure. Still, it also warns that upside follow-through is losing urgency near the 198 to 199 zone.
The hourly Bollinger midpoint sits at 198.75, above the last close. The upper band is at 205.87, while the lower band is at 191.63. This indicates price is hovering just below the center of the short-term range rather than pressing into expansion.
Hourly pivot levels tell a similar story. The pivot is 197.47, with resistance at 198.81 and support at 196.53. COIN is holding just above pivot, which keeps the intraday tone constructive. However, it has not clearly broken the resistance band yet.
15-Minute Coinbase Stock Setup Favors Timing, Not a New Thesis
On the 15-minute chart, the setup is useful mainly for timing rather than changing the broader view. Price at 197.88 is above the 20-period EMA at 196.22, the 50-period EMA at 196.53, and the 200-period EMA at 195.55. That shows near-term buyers are still active.
RSI at 60.66 and a positive MACD histogram of 0.31 reinforce that short-term momentum is leaning upward. In practical terms, the very near-term tape still favors retests of the session highs.
At the same time, the 15-minute pivot is 197.91, almost exactly where the stock last traded. Resistance sits at 198.37 and support at 197.42. That means COIN is effectively sitting on a trigger level. A clean hold above pivot and a push through 198.37 would align the intraday action with the constructive daily bias. If it slips back under 197.42, the short-term bid would start to look less secure.
Coinbase Stock Outlook: Bullish and Bearish Scenarios Into Earnings
The key conflict across timeframes is clear. The daily chart says the recovery is intact but incomplete. The hourly chart agrees on trend direction, yet it shows fading momentum. The 15-minute chart is stronger again, but only in a tactical sense. Therefore, Coinbase Stock is not sending a fully synchronized bullish signal.
The stock is holding firm into a major catalyst, but the momentum profile remains uneven.
Bullish Scenario
The bullish scenario is straightforward. COIN needs to hold above the 194.64 to 196.57 support-pivot zone on the daily framework and then clear 199.89 with conviction. If that happens, the next upside area would likely be shaped by a move toward the upper daily Bollinger region near 216.54, especially if earnings and guidance are received well.
A sustained move above 199 to 200 would also show that buyers are willing to absorb event risk rather than fade it.
Bearish Scenario
In contrast, the bearish scenario starts with failure around the 198.81 to 199.89 resistance band and a move back below hourly support at 196.53. If sellers then force a daily break under 194.64, the short-term bullish structure would begin to unravel.
That would also put price back under the 20-day and 50-day EMA cluster, removing an important layer of technical support. In that case, the market would likely treat the recent rebound as a temporary bounce inside a still-fragile broader structure.
Overall View on Coinbase Stock
Overall, Coinbase Stock is trading with a mild upside bias, but it remains an event-risk story first and a technical setup second. The daily chart has improved, yet the stock is still below its 200-day trend line and sitting just under nearby resistance.
With earnings close and options implying a large swing, positioning looks cautious rather than confident. Therefore, volatility is likely to dominate the next move, and the current technical picture still leaves room for a sharp break in either direction.
