


 5
5
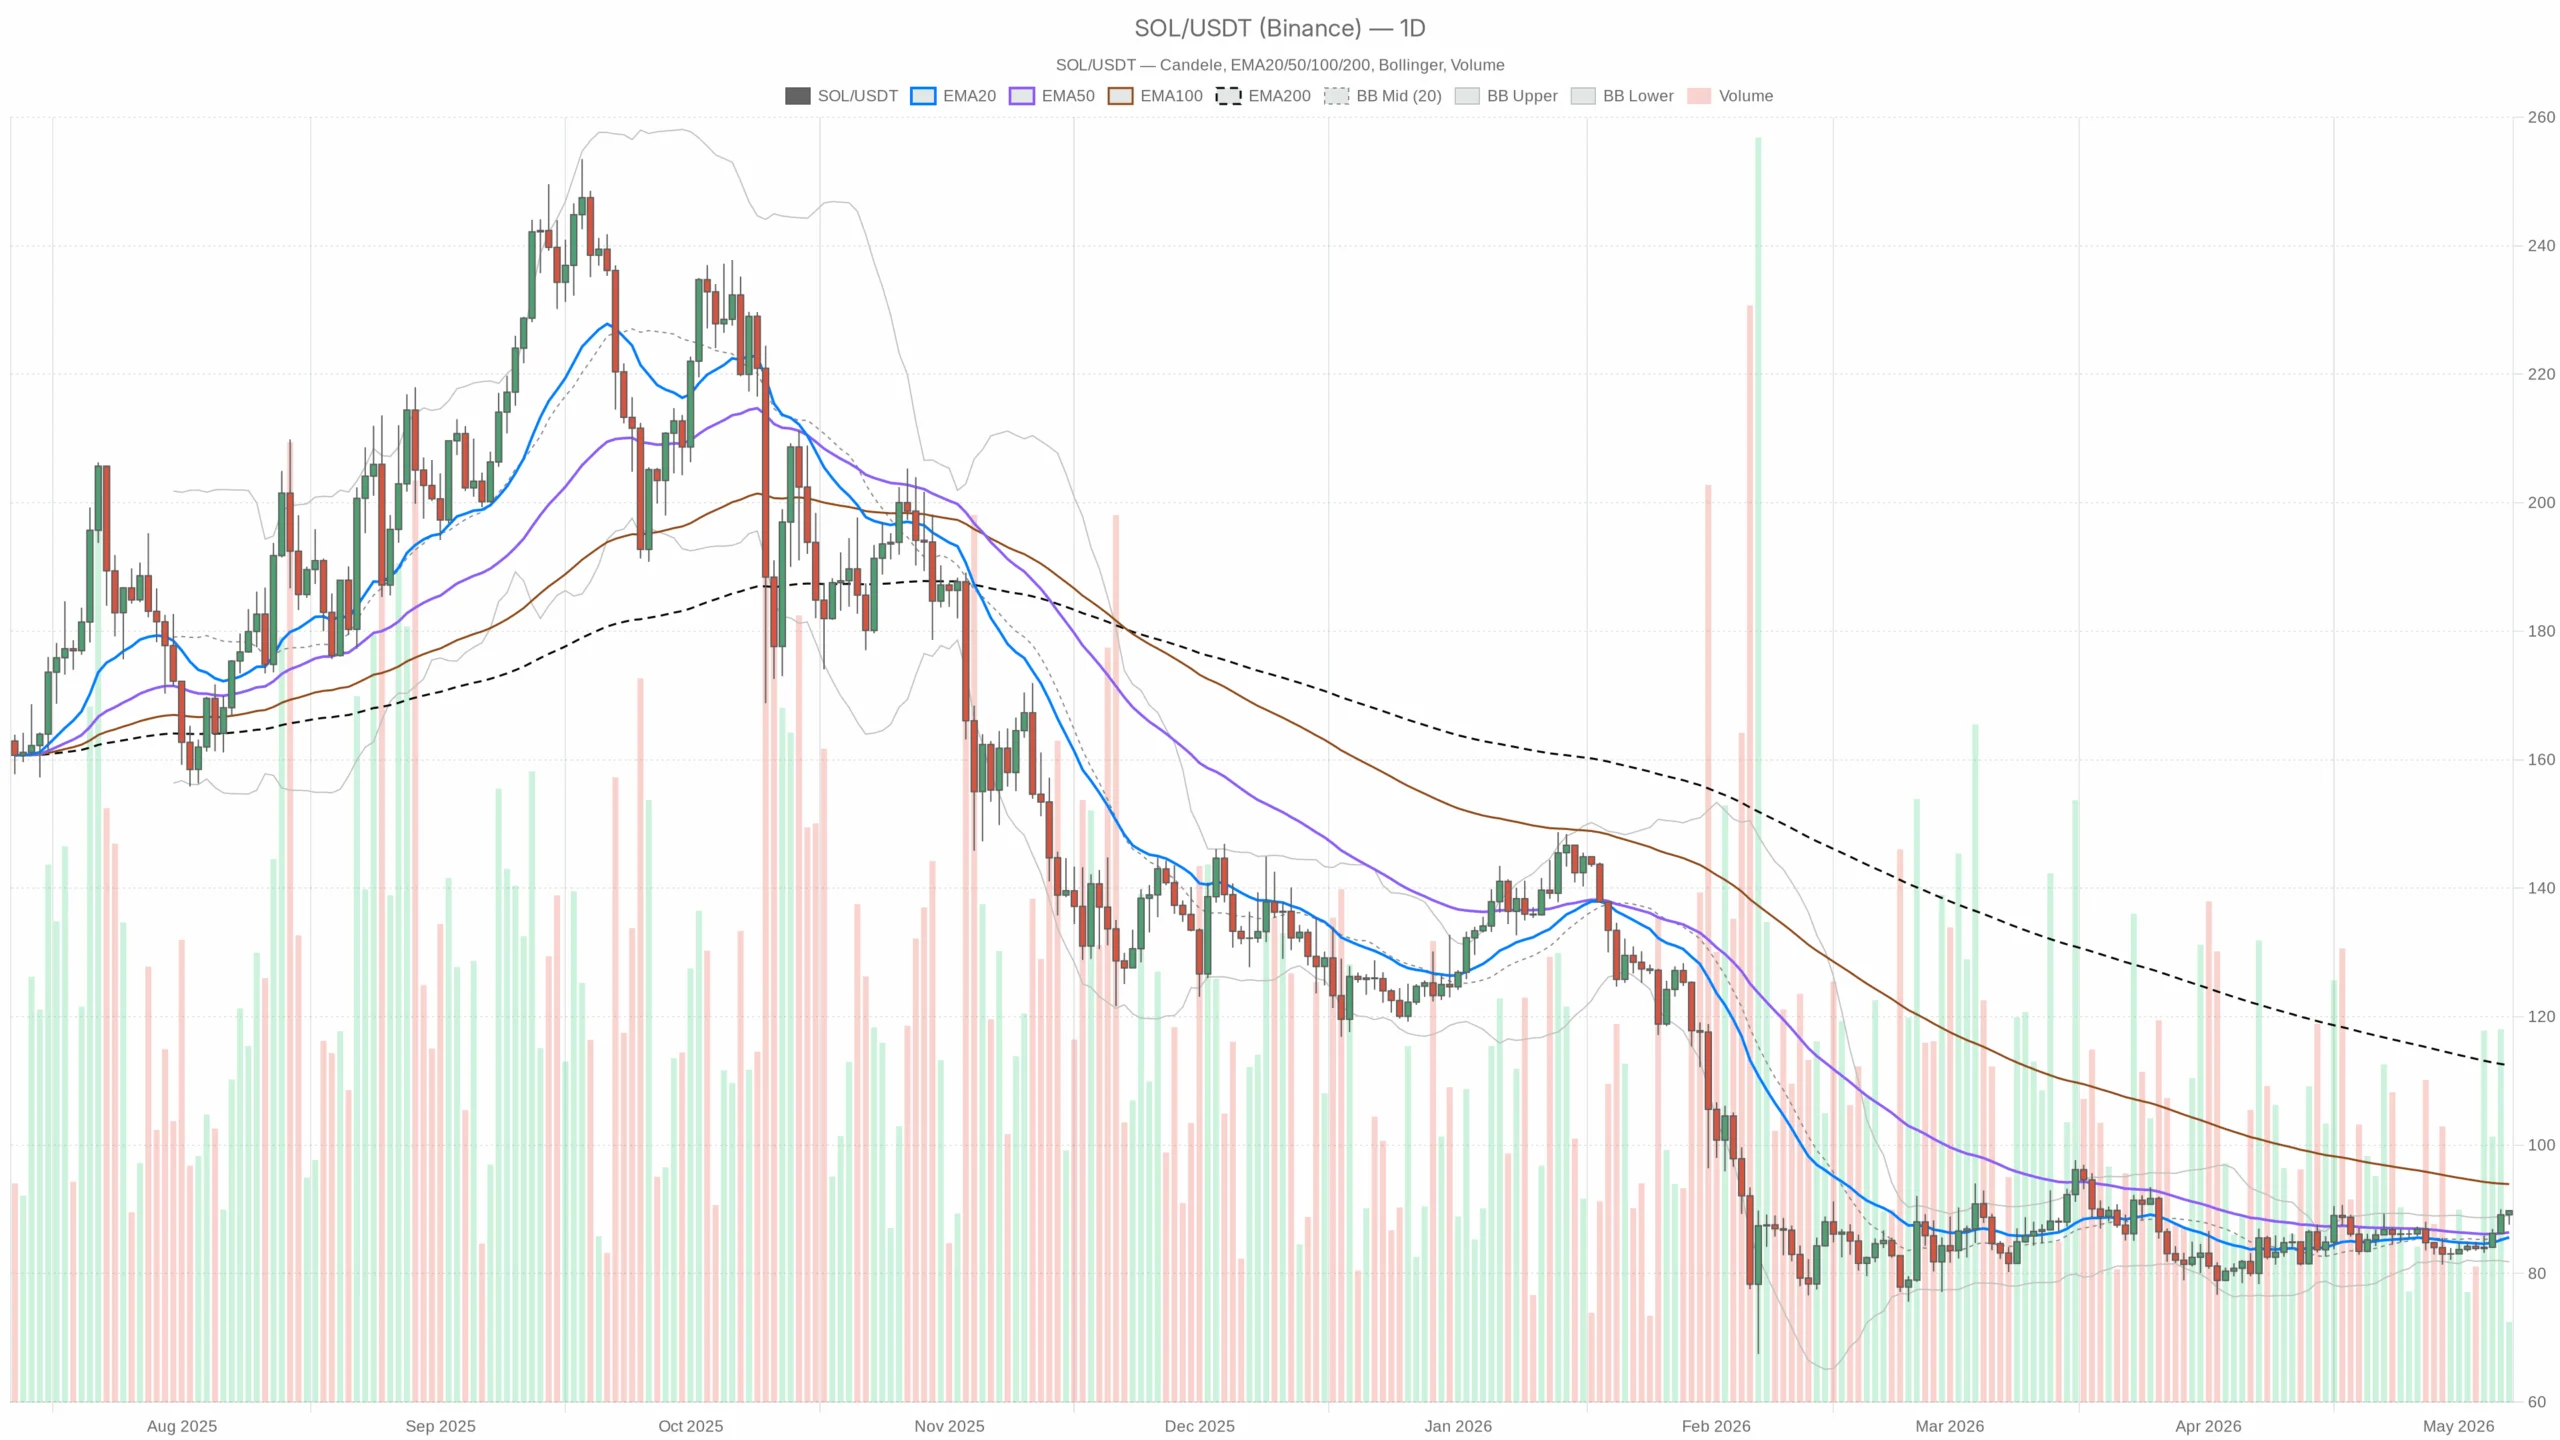
As $SOL presses into a major decision area, Solana crypto today shows a market testing whether improving momentum can become a sustained breakout near $90.
Main scenario: Neutral-to-bullish, with the daily chart leaning constructive
Based on the daily timeframe, the primary read is neutral-to-bullish. Price at 89.8 is above the 20-day EMA at 85.66 and the 50-day EMA at 86.41. That tells you buyers have regained control of the nearer-term trend.
At the same time, $SOL remains below the 200-day EMA at 112.41. Therefore, this is still a recovery inside a broader damaged structure rather than a fully confirmed macro uptrend.
The shorter timeframes support the bullish side for now. However, they also show the move is getting crowded in the very near term. The 1-hour chart remains firm, while the 15-minute chart is already stretched.
That creates a classic setup. The broader short-term bias is up, but chasing strength into resistance becomes riskier unless price can decisively break and hold above it.
Daily chart: improving trend, but not a clean macro breakout yet
On the daily chart, $SOL closing at 89.8 above both the 20 EMA (85.66) and 50 EMA (86.41) is a meaningful shift. The fact that the 20 EMA is slightly below the 50 EMA shows the trend recovery is still relatively fresh.
What that means in practice: buyers have the tactical edge, yet the bigger trend remains incomplete because the 200 EMA at 112.41 is still far above current price. Until that long-term barrier starts coming into play, this move is better viewed as bullish repair, not a full trend reversal.
The daily RSI sits at 62.54. That is strong enough to confirm improving momentum, but not so extreme that it automatically signals exhaustion.
Read on the tape: momentum is healthy, and bulls still have room to operate. It is supportive, but not euphoric.
Daily MACD is positive, with the line at 0.53, signal at 0.03, and histogram at 0.5. That is a solid momentum tailwind and one of the cleaner bullish pieces of evidence in this setup.
What that tells us: upside pressure is real, not just a random price spike. In this context, Solana crypto today reflects momentum that is backing the recovery.
Bollinger Bands on the daily chart show the middle band at 85.48, the upper band at 89.11, and the lower band at 81.84. Price is trading slightly above the upper band.
The practical takeaway: $SOL is pushing hard enough to test the edge of its recent volatility envelope. However, that also warns that the market may need a pause or brief pullback before sustaining another leg higher.
Daily ATR is 2.4, which gives a fair sense of normal price travel. For a coin trading near $90, that is enough to make intraday swings meaningful without implying total disorder.
Why it matters now: volatility is active but not chaotic. Traders should still expect sharp movement around resistance and key levels.
Pivot levels on the daily chart place the main pivot at 89.08, resistance at 90.54, and support at 88.35. Current price is hovering just above the pivot and close to daily resistance.
That is the real battlefield: a clean hold above 89.08 keeps the short-term advantage with buyers, while a push through 90.54 would strengthen the bullish continuation case. Losing 88.35 would be an early sign that the breakout attempt is fading.
1-hour chart: trend intact, momentum cooling slightly
The 1-hour chart is where the bullish case gets confirmation, but also where the first hint of tension appears. Price at 89.81 is above the 20 EMA (88.65), 50 EMA (87.66), and 200 EMA (85.73).
Translation: buyers are still in control of the shorter trend structure, and dips are being supported rather than sold aggressively.
The 1-hour RSI is 64.16, which stays constructive without reaching an extreme. Moreover, it implies momentum is still positive, but not as fresh as it was earlier in the move.
The more interesting detail is the 1-hour MACD: line at 0.37, signal at 0.41, histogram at -0.05. That is not a bearish reversal by itself, but it does show momentum has softened even while price remains elevated.
This is the first real warning sign: price is holding high, but momentum is no longer accelerating. That often happens just before either a brief consolidation or a breakout retest.
On the 1-hour Bollinger Bands, the midline is 88.86, upper band 89.93, and lower band 87.79. Price is pressing near the upper band again.
How to read that: the intraday trend still leans upward, but there is not much room for error if buyers cannot expand above the band with conviction.
The 1-hour ATR is 0.66, which means shorter-term fluctuations are still active. Therefore, enough volatility remains in the market for quick tests of nearby support and resistance.
Intraday pivot levels sit at 89.59 for the pivot, 90.04 for resistance, and 89.36 for support. Holding above 89.59 keeps buyers in the driver’s seat.
Rejection from 90.04 combined with a drop under 89.36 would suggest the market is slipping into short-term mean reversion.
15-minute chart: bullish execution context, but stretched
The 15-minute chart is useful here only for execution context, and it says the move is still bullish but hot. Price at 89.91 remains above the 20 EMA (88.82), 50 EMA (88.68), and 200 EMA (87.65).
That tells you: the immediate tape is clearly upward, and pullbacks have been shallow.
The 15-minute RSI is 71.73, which is now in stretched territory. However, that does not automatically mean price must fall.
It does mean upside entries become less attractive unless there is either a breakout confirmation or a reset.
The 15-minute MACD remains positive, with line 0.28, signal 0.08, and histogram 0.2. In plain terms, the immediate push still has fuel.
Because RSI is already elevated, the market is vulnerable to short-term shakeouts.
The 15-minute Bollinger Bands show the midline at 88.53, upper band at 89.77, and lower band at 87.3. Price is above the upper band.
That usually means one of two things: either a genuine momentum expansion is underway, or the market is briefly overreaching and needs to cool off. The next candles matter more than the current one.
The 15-minute ATR is 0.35, which is enough for quick local swings around nearby levels. For execution, this is a reminder that entries taken too late can get punished even if the broader idea is correct.
Short-term pivot levels come in at 89.81 for the pivot, 90.02 for resistance, and 89.71 for support. Therefore, the next move through 90.02 or back below 89.71 can define the immediate intraday direction.
Market backdrop and positioning
The wider crypto market is not providing a dramatic macro tailwind. Total market cap is up only modestly over the past 24 hours, Bitcoin dominance remains elevated at 58.64%, and fear and greed is neutral at 47.
That is not the kind of backdrop that screams broad altcoin mania. For Solana specifically, that makes this local strength more interesting.
It suggests $SOL is trading on its own relative strength for now. However, it also means the move may need to prove itself without major help from a full risk-on alt market.
There is also a subtle supportive backdrop in Solana-related DeFi activity, with notable fee growth across names like Raydium AMM, Orca, and Meteora over recent periods.
The message there: ecosystem activity is not collapsing, which helps support the idea that $SOL can keep attracting speculative interest if price structure stays firm.
Bullish scenario
The bullish path is straightforward: $SOL holds above the daily pivot at 89.08, absorbs any short-term profit-taking, and converts the 90.04-90.54 resistance zone into support.
If that happens, the daily momentum profile likely remains favorable, and the market can start building toward a larger continuation leg.
What would validate it: sustained trading above 90.54 on the daily structure, ideally with the 1-hour MACD turning back up and the 15-minute overbought condition resetting without meaningful price damage.
What would invalidate the bullish case: a failed breakout followed by a drop back below 89.08, especially if price then loses 88.35. That would signal buyers are not yet strong enough to hold the breakout zone.
Bearish scenario
The bearish case is not the primary one on the daily chart, but it is easy to map. $SOL is already pressing above its daily and 15-minute upper Bollinger Bands, while the 1-hour MACD has started to weaken.
If buyers cannot force a clean break through resistance, the market may rotate into a pullback toward the midrange.
What would confirm it: repeated rejection around 90.04-90.54, followed by a move under 89.36 on the 1-hour chart and then under 88.35 on the daily pivot structure.
That would shift the move from trend continuation to failed breakout.
What would invalidate the bearish case: strong acceptance above 90.54 with intraday pullbacks staying shallow and price continuing to hold above the 20-hour EMA.
Final take
The daily chart gives bulls the edge because price is above the 20 and 50-day EMAs, RSI is firm, and MACD is supportive. The problem is that $SOL is testing resistance while the shorter intraday momentum profile is beginning to overheat.
That is usually where good trends either prove themselves or fake out late buyers. Moreover, the key distinction is between strength that holds and strength that stalls.
Above the pivot zone, $SOL keeps a bullish tactical posture. Back below it, the market becomes vulnerable to a sharper mean-reversion move. In sum, volatility is active enough to punish poor timing, and the disagreement between strong price structure and softer hourly momentum deserves respect.
