


 19
19
While $XRP remains under pressure in 2026, historical patterns suggest a strong base could trigger a major rally toward $8, $13, and $27.
Market analyst Chart Nerd revealed that $XRP follows repeating cycles, where corrections lead to strong breakouts. He expects a possible bottom between $0.70 and $0.90 in 2026, which could set up massive upside based on Fibonacci extension levels.
Key Points
- Chart Nerd says $XRP has seen over 10 years of repeating cycles with strong rallies following corrections.
- Past breakouts came after long consolidation phases, including moves from $0.10 to $2 and $0.40 to $3.60.
- $XRP may see short-term relief toward $1.80-$2.00 before another correction phase.
- A likely bottom could form between $0.70 and $0.90 based on historical support trends.
- Fibonacci projections suggest upside targets of $8, $13, and $27 if a solid base forms.
Past $XRP Cycles Following Specific Patterns
According to Chart Nerd’s latest analysis, $XRP’s price action over more than 10 years has followed a repeated cycle. He noted that these patterns can help investors understand what may happen next, especially in identifying where the price could settle before moving higher.
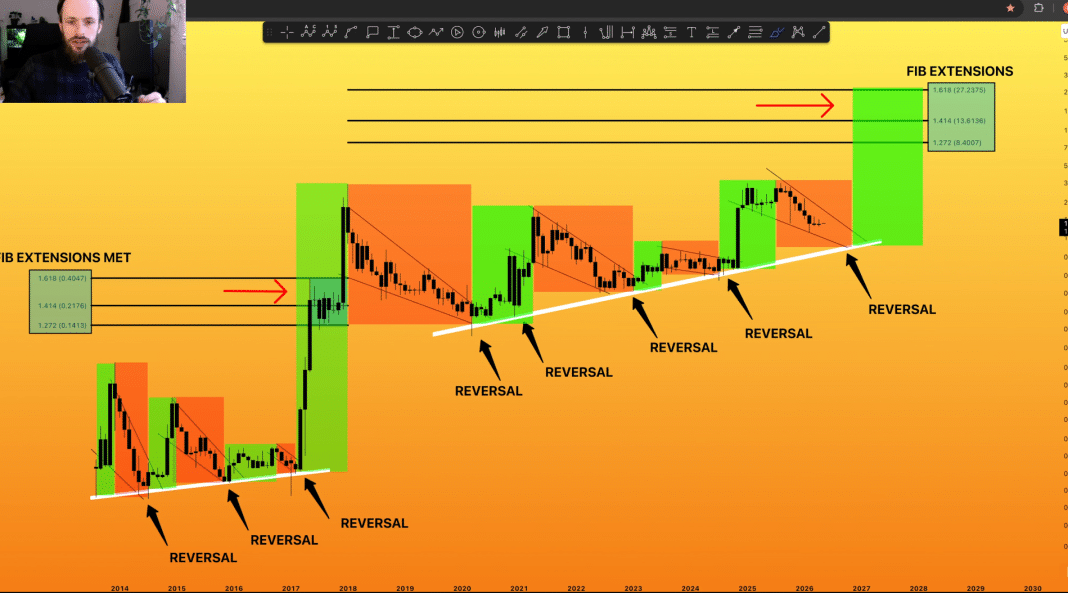
Chart Nerd focused on key zones that have often signaled strong upward moves instead of trying to time the exact bottom of this ongoing downtrend. He used Fibonacci extensions to compare the 2017 rally with the period between the 2018 peak and the 2020 low, using both to estimate future targets.
He noted that $XRP has reached these Fibonacci levels before, which suggests it could do so again. His chart highlights green areas for strong upward moves and red areas for sharp declines or bear markets. These cycles show a pattern of “rise, correction, and then another rise.”
The analyst also called attention to pivotal long-term rising support lines. Over roughly 13 years, every time $XRP has dropped back to these lines during weak periods, it has later moved up strongly.
A Repeating Pattern From 2013 to 2025
For context, $XRP reached a peak of $0.0614 in 2013, then formed a rising support line with touches in 2014, 2015, and 2017. After this, it surged and met Fibonacci targets between $0.14 and $0.40, following a long period of trading between $0.003 and $0.04.
Chart Nerd explained that $XRP spent years moving within a tight range before breaking out. This pattern of long consolidation leading to a strong rally has appeared in multiple cycles, with the rising support line holding firm until the 2017 breakout.
In the next cycle, $XRP peaked at $3.31 in 2018 and later dropped to around $0.10 to $0.12 in 2020. From there, it formed another rising support line that is still in place today.
A bounce in 2020 pushed the price from $0.10 to $2 in 2021. Another move from about $0.30 brought it close to $1, and a later rise from around $0.40 sent $XRP to about $3.60 in July 2025, marking the latest all-time high.
Possible $XRP Bottom for Ongoing Downtrend
Chart Nerd pointed out that each return to the rising support line has marked the start of a new upward move. During weak periods, $XRP often forms patterns like falling wedges or channels, where the price tightens before breaking out.
According to him, the current situation is another correction, not a major breakdown. The analyst believes $XRP is not heading to zero. Instead, the long-term trend still shows higher lows, which suggests a gradual move upward over time.
In the near term, he believes $XRP could rise toward $1.80 to $2.00, but this may only be a short-term recovery before another drop. He expects the price to form a bottom later in 2026, possibly in Q2 or Q3, with the key support area between $0.70 and $0.90.
$XRP Building Foundation for Higher Targets
Even if $XRP falls into the $0.70 to $0.90 range, Chart says this is not a negative sign, but a normal part of the cycle and a possible opportunity. He pointed out that $XRP has gone through similar or even deeper declines in the past, often followed by stronger recoveries.
If $XRP settles around $0.80, Fibonacci projections suggest large gains could follow. A rise to $8 would mean about a 9x increase, while $13 would be close to a 16x gain based on the 1.414 level. The 1.618 level points to a possible move to $27, which would be about a 32x increase.
Even if $XRP does not drop to lower levels and instead forms a base higher up, the analyst still expects gains of about 5x to 20x. While he remains confident in $XRP and Ripple’s long-term direction, he also noted that the asset often goes through long periods of decline and sideways movement.
Meanwhile, Chart Nerd added that if $XRP breaks above key levels such as $1.80, $2.00, and $2.40, this could change the outlook and possibly lead to a stronger move upward sooner than expected.
