


 3
3
An analyst has highlighted how Dogecoin crossed a Parallel Channel’s midline after its latest rally and is now heading toward its resistance level.
Dogecoin Could Face Resistance At $0.1172 Next
In a new post on X, analyst Ali Martinez has talked about a Parallel Channel forming in the 12-hour price of Dogecoin. A “Parallel Channel” is a technical analysis (TA) pattern that forms whenever an asset observes a phase of consolidation between two parallel trendlines.
Like with other consolidation channels in TA, the upper level of a Parallel Channel tends to be a source of resistance for the coin, while the lower one that of support. A break out of either of these bounds can signal a continuation of trend in that direction. That is, a surge above the channel can be a bullish sign, while a drop under it a bearish one.
Parallel Channels can be classified into a few different types based on how the channel is oriented with respect to the graph axes. Channels with a positive slope are known as Ascending Channels, while those pointing down are called Descending Channels.
In the context of the current topic, the simplest case is the one of relevance: a Parallel Channel that’s parallel to the time-axis. Such a pattern corresponds to a phase of true sideways movement in the asset.
Now, here is the chart shared by Martinez that shows the Parallel Channel that the 12-hour price of Dogecoin has been stuck inside for the last couple of months:
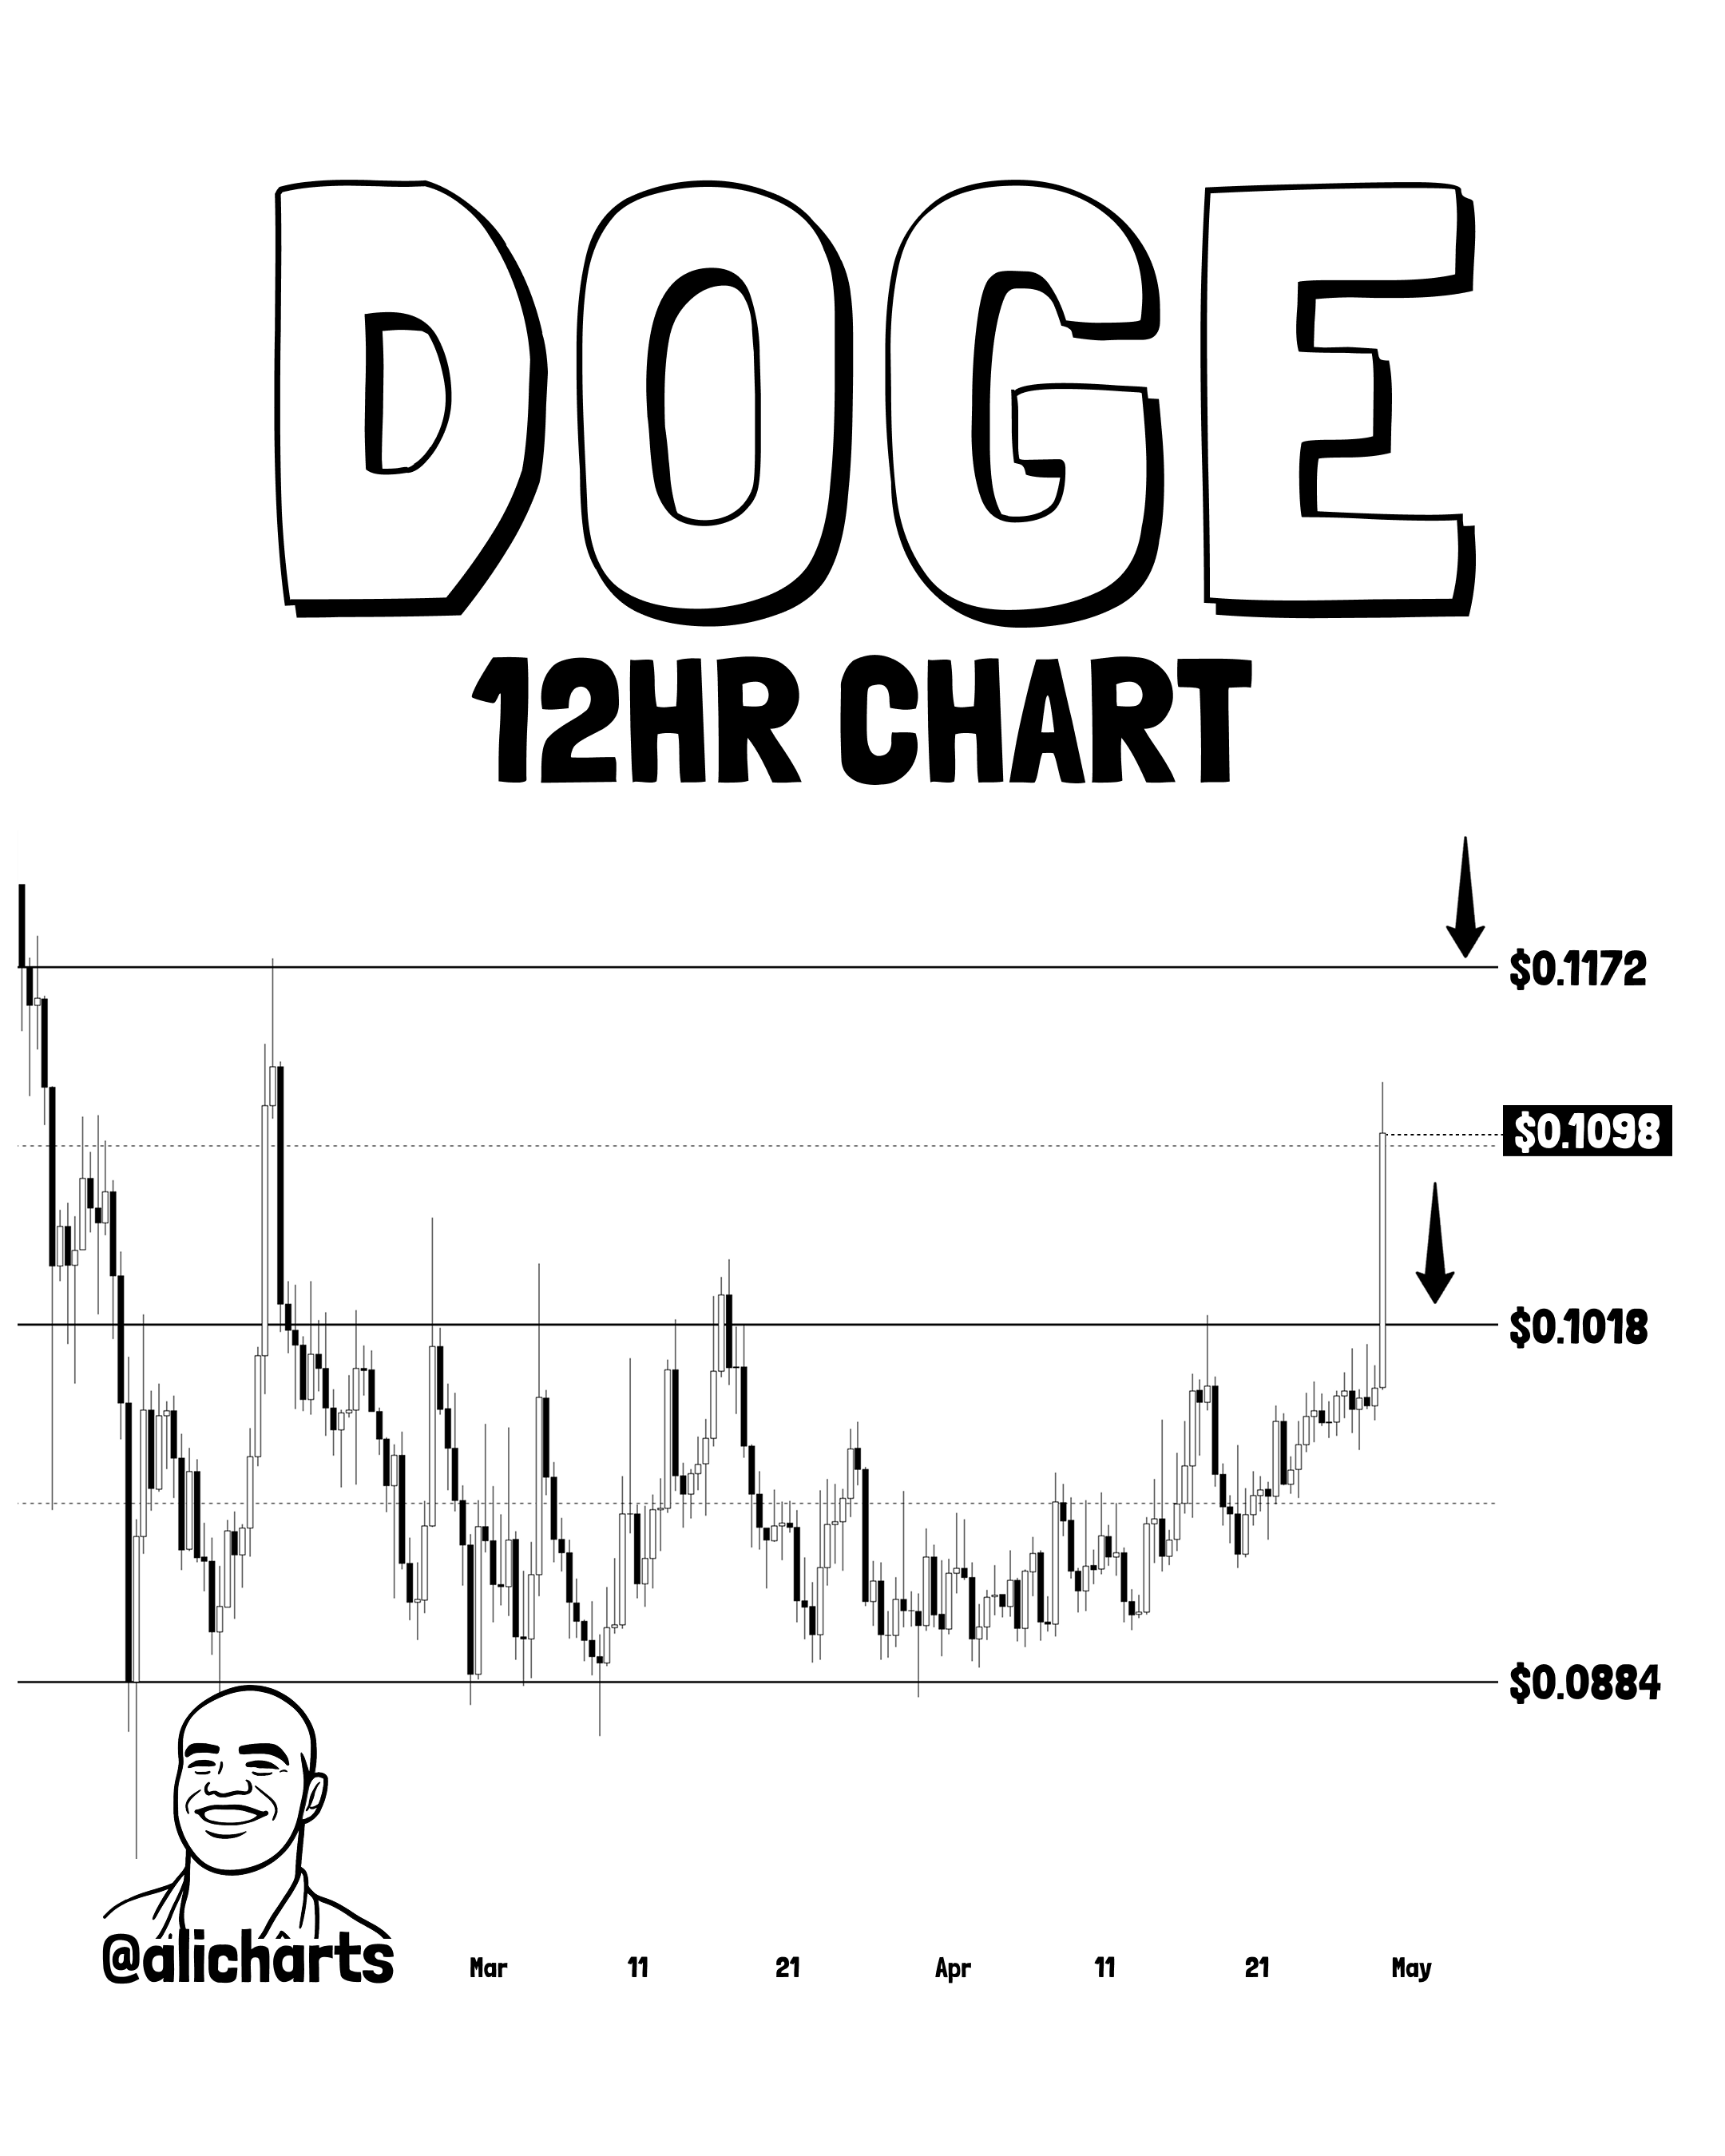
As displayed in the above graph, the 12-hour Dogecoin price was earlier trading inside the lower half of the Parallel Channel, with the pattern’s midline situated at $0.1018 acting as a barrier for the memecoin. The 11% price jump for the past week, however, has meant that $DOGE has finally broken past this resistance.
The next relevant level in the channel is located at $0.1172, corresponding to the top level. It now remains to be seen whether the Dogecoin will perform a retest of this level in the near future or not.
While Dogecoin has seen some bullish price action recently, fellow altcoin Solana has headed down instead. A consequence of this decline has been that $SOL has dropped below the support level of a TA pattern, as the analyst has pointed out in another X post.
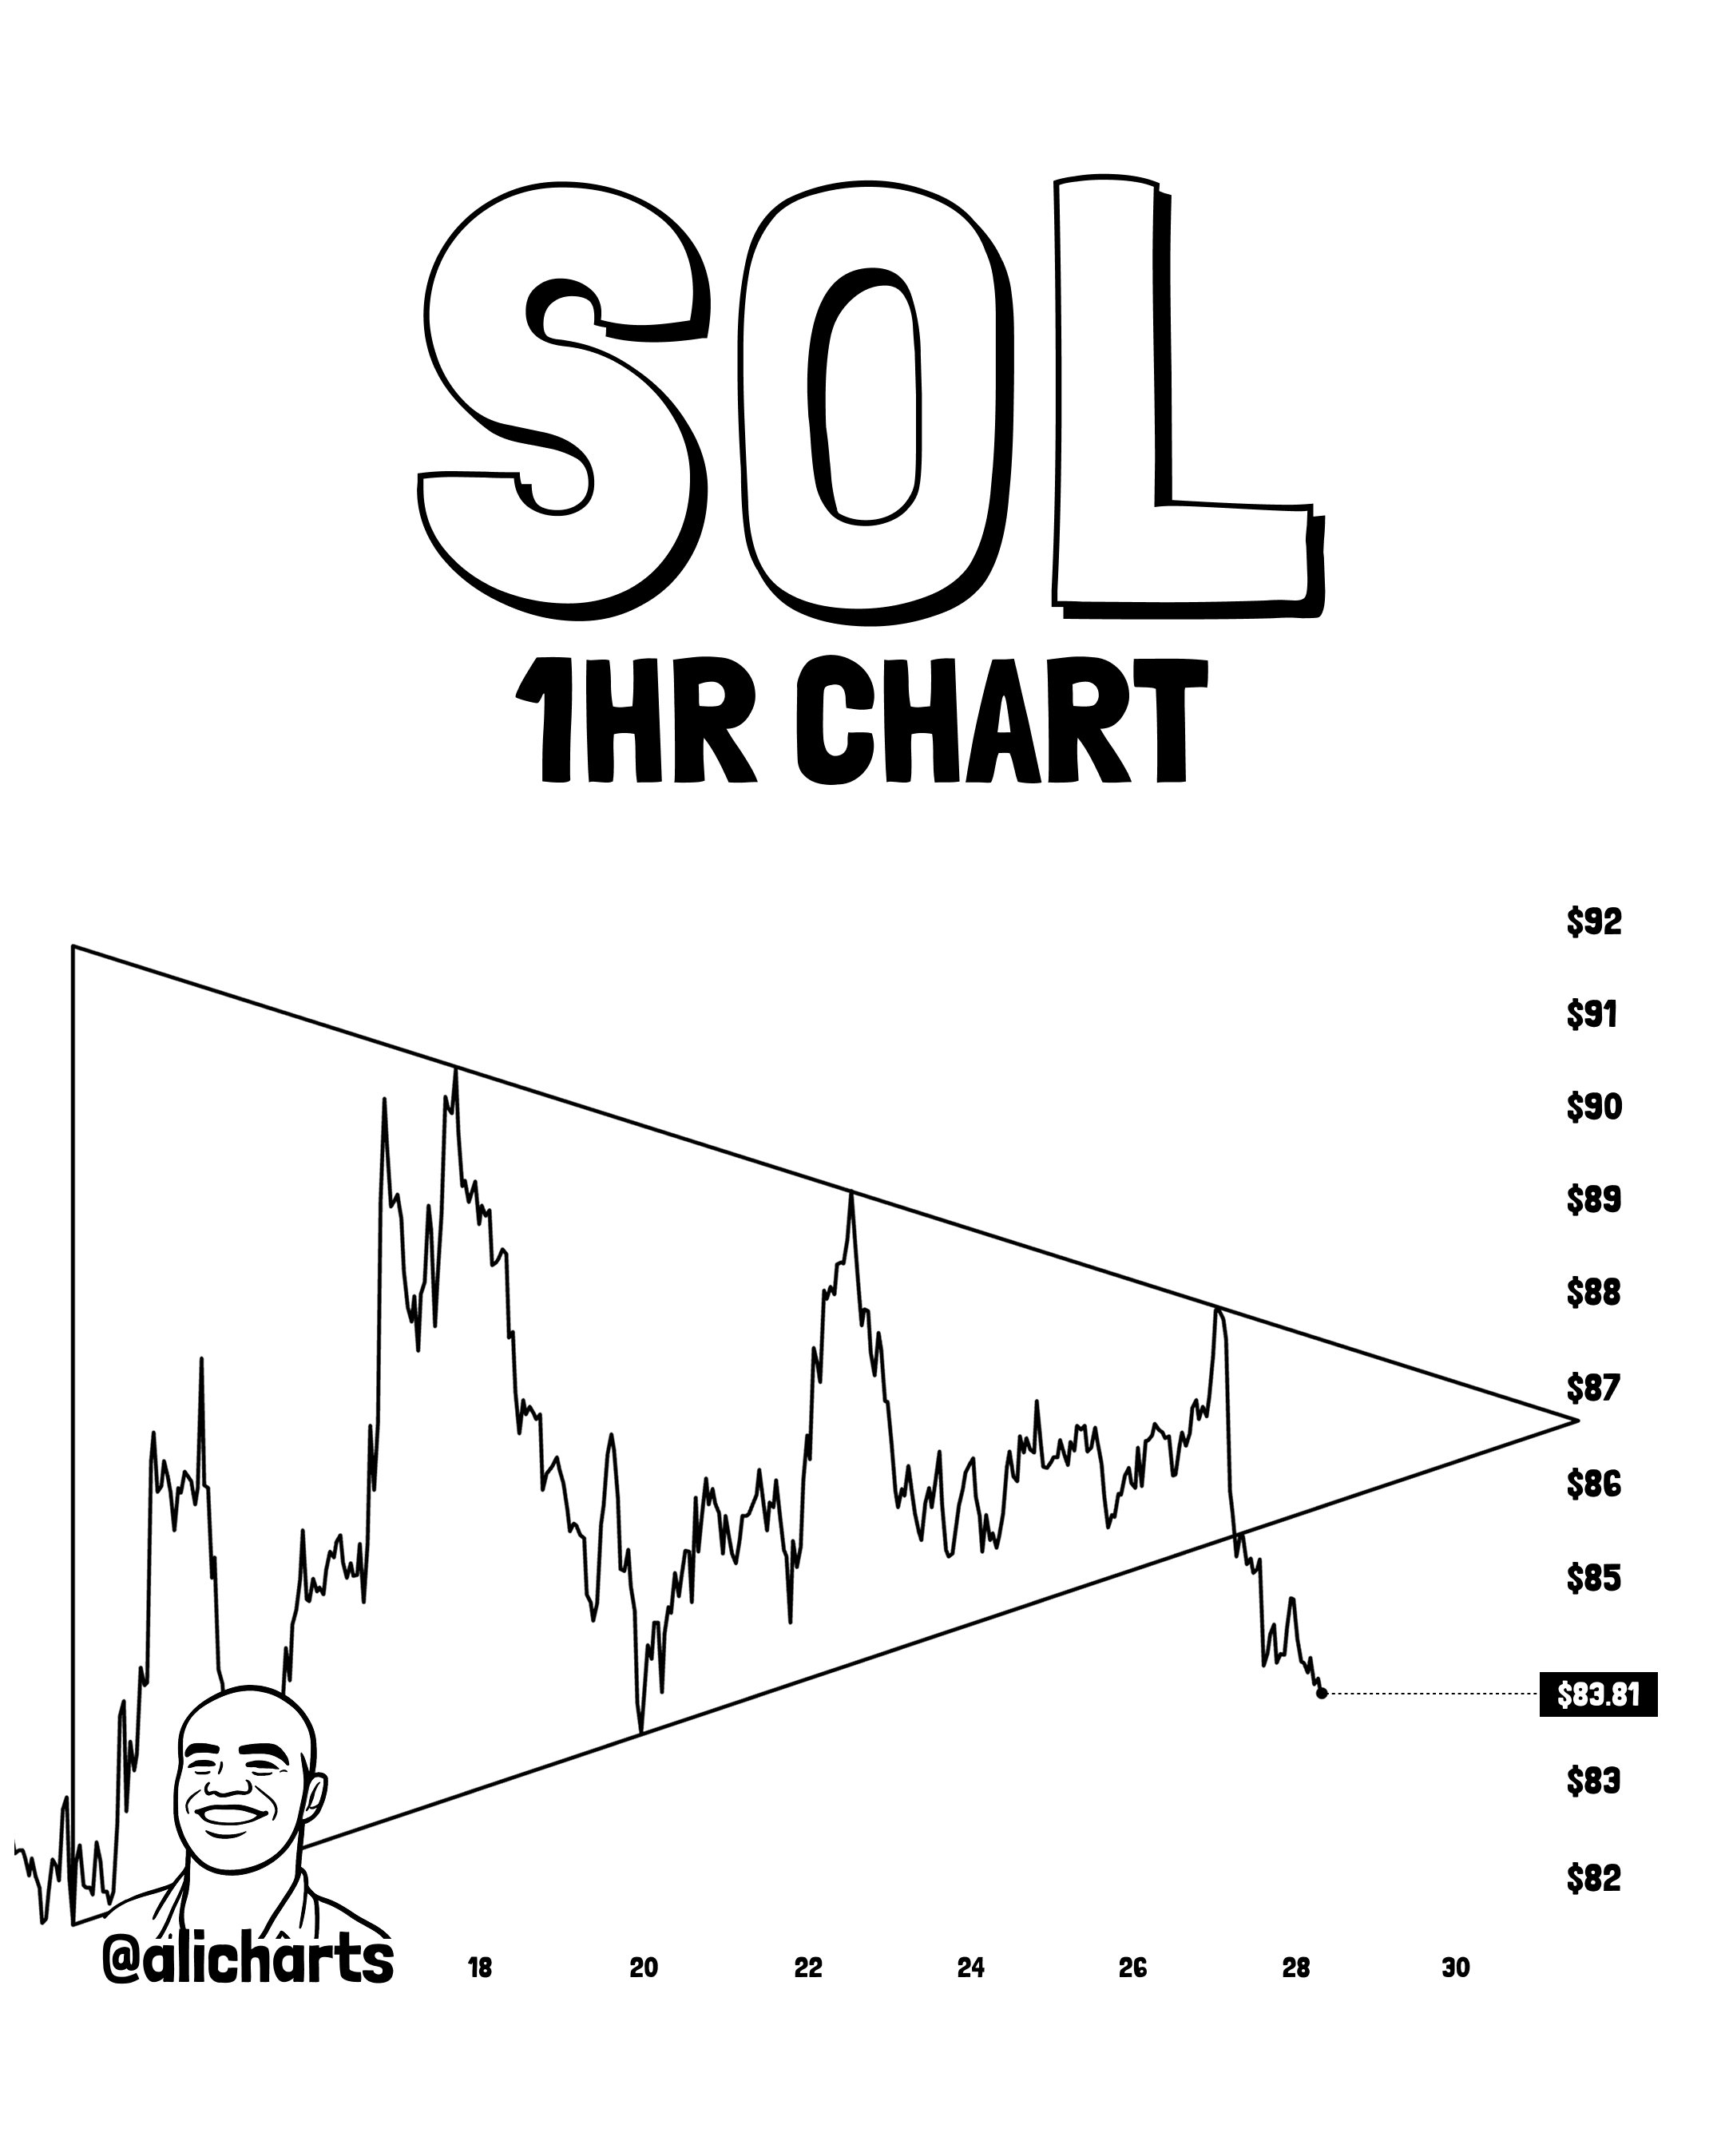
From the chart, it’s visible that Solana was earlier trading inside a channel enclosed by two converging trendlines approaching each other at a roughly equal and opposite angle. Such a pattern is called a Symmetrical Triangle. Breakouts from this type of channel become likely as the asset approaches the apex, which is what appears to have happened with $SOL this time as well.
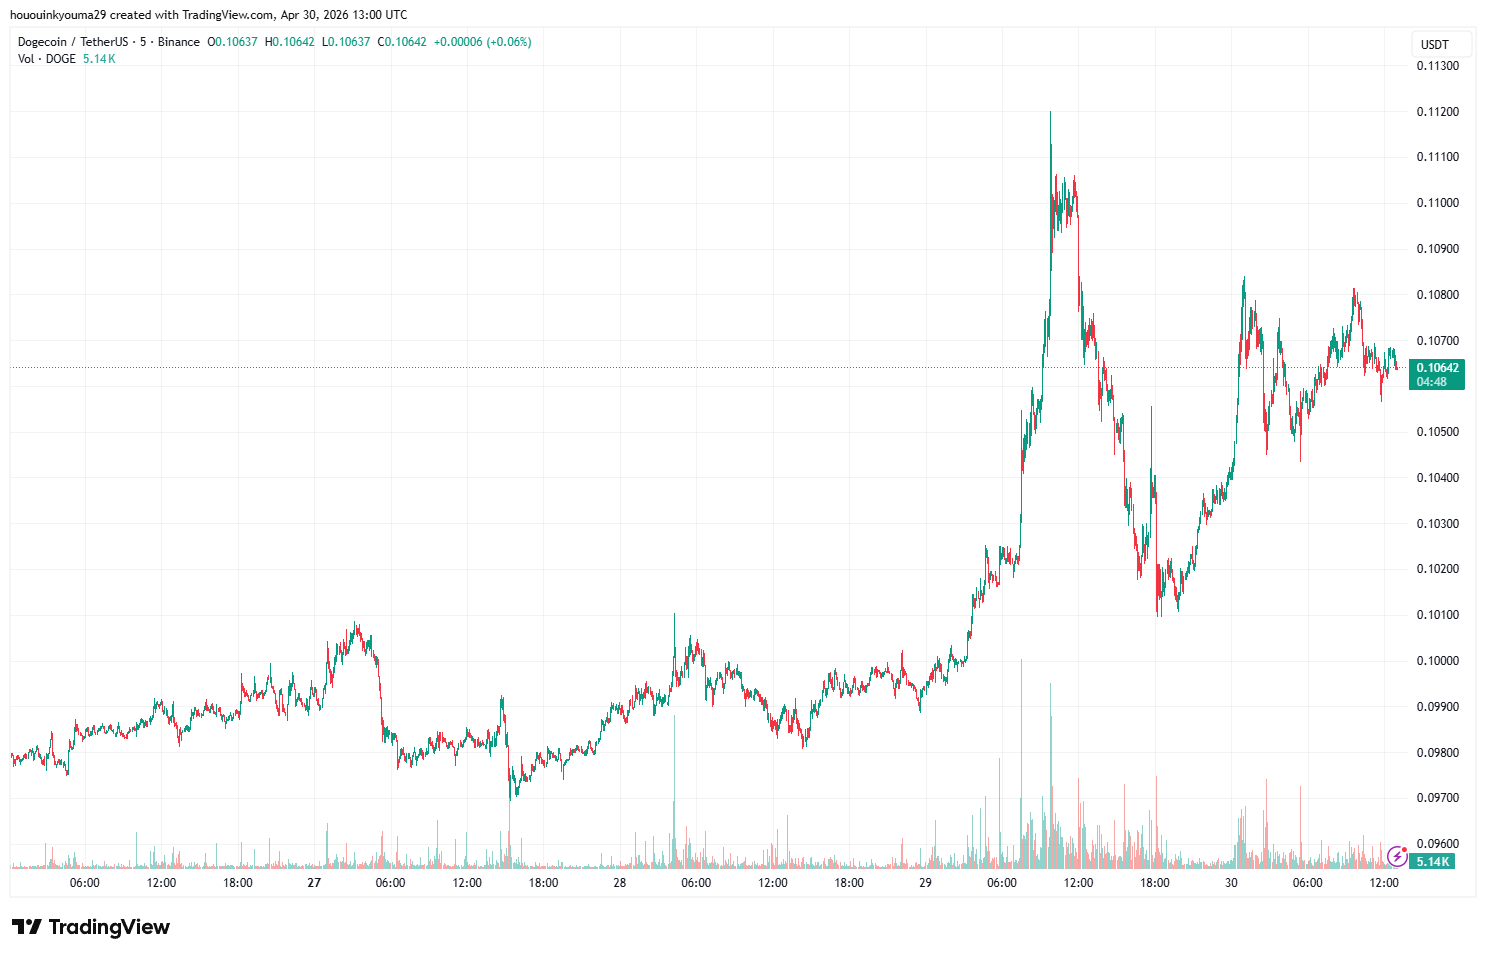
$DOGE Price
Dogecoin has surged to the $0.1064 level following its latest rally.