
 2
2
$XRP is trading around $1.41, extending a mild pullback after briefly testing the $1.45 area on CoinMarketCap.
The move has left the token stuck in a tight range, with price action now compressed between $1.39 and $1.46.
Despite multiple attempts to break higher, momentum faded quickly as broader crypto sentiment weakened and buyers failed to sustain pressure above resistance.
Over the past 24 hours, $XRP has slipped about 1.1%, underperforming a slightly weaker Bitcoin and reflecting a wider shift away from altcoins.
Notably, the decline was not driven by any $XRP-specific development.
Instead, it aligned with a broader market rotation where Bitcoin dominance edged higher toward 60%, signalling capital moving out of riskier assets.
Selling pressure builds as volume spikes
The $XRP price drop was accompanied by a sharp rise in trading activity.
The $XRP volume has climbed roughly 51% to about $1.7 billion according to CoinMarketCap, showing that the move was backed by real participation rather than low-liquidity drift.
This level of activity suggests that sellers were active during the pullback, reinforcing downward pressure as the price slipped away from recent highs.
At the same time, $XRP continues to behave like a high-beta asset within the crypto market.
A broader decline in total crypto market capitalisation of about 0.38% was enough to trigger proportional weakness in $XRP, which fell roughly in line with the wider market.
This pattern reflects a consistent theme across recent sessions: $XRP is reacting more to overall liquidity conditions than internal developments.
Key support at $1.40 now the focal point
The current price structure now centres on a clearly defined support zone around $1.40 to $1.41.
This area has repeatedly acted as a short-term pivot. As long as $XRP holds above it, the market remains in a consolidation phase rather than a full breakdown.
If support at $1.40 fails, the next level traders are watching sits near $1.39.
Below that, downside pressure could extend further as liquidity thins out in the lower range.
On the upside, $XRP faces immediate resistance at $1.43, a level that has repeatedly capped recovery attempts.
A daily close above that zone would open the door toward $1.46 to $1.47, where short-term projections cluster.
However, technical indicators show a mixed picture with 7 out of 23 tracked technical indicators signalling a bullish trend, 6 leaning bearish, and 10 showing neutral readings, reflecting a lack of strong directional conviction.
Most importantly, while the 14-day RSI sits near 52, a neutral level that suggests the market could go either way, the weekly RSI near 37 signals broader weakness still lingering beneath the surface.
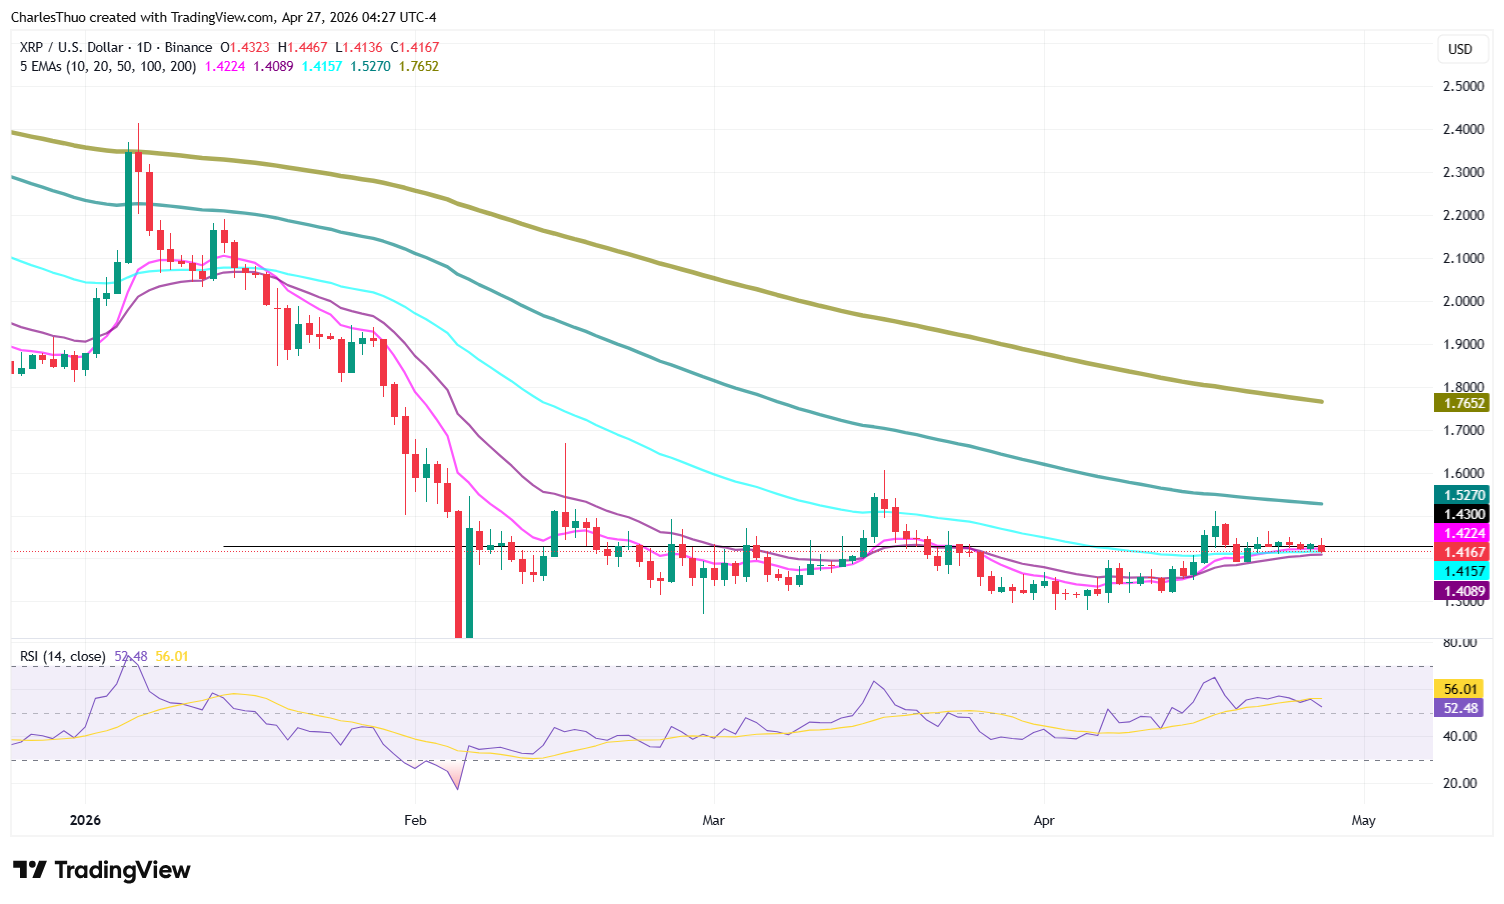
In addition, $XRP has only reclaimed the 10-day EMA, 20-day EMA, and the 50-day EMA, while the 100-day and 200-day EMAs remain above $XRP's price, acting as layered resistance.
This configuration typically reflects a market that is recovering in the short term but still constrained by longer-term pressure.
$XRP price forecast: range-bound unless $1.43 breaks
Near-term projections suggest $XRP remains in a consolidation phase unless key levels break.
A move above $1.43 could extend momentum toward $1.47, which is the next short-term target based on technical projection models.
On the downside, a failure to hold $1.40 would likely expose $1.39, with further weakness possible if selling volume remains elevated.
Longer-term outlook models show wider scenarios rather than a single trajectory.
Estimates for 2026 place $XRP in a broad range between approximately $0.86 and $2.28, reflecting the uncertainty around macro conditions and liquidity cycles.
While some projections extend higher into future cycles, current price action remains firmly in a consolidation phase with the next breakout direction dependent on whether buyers can reclaim resistance at $1.43 or whether sellers force a breakdown below $1.40.
