

 11
11
Stable [$STABLE] witnessed a violent price swing on Thursday, the 23rd of April. Within a single day, the altcoin had rallied 52.8%, from $0.026 to $0.03975. The swift gains were not sustained.
On Friday, the prices, which briefly reached a local high of $0.0451, crashed by 31.6%. At the time of writing, it was trading at $0.319.
An earlier AMBCrypto report reasoned out why $STABLE could be rallying. Increased stablecoin adoption in RWAs and traditional finance meant stablecoins were being pushed into everyday financial flows.
As a result, the Stable network was projected to see increased revenue due to the rising demand and the spike in gas fees, which could aid $STABLE’s price action.
Despite the strong gains and sizeable pullback, traders need to be wary of the $STABLE trend—or the lack thereof.
Looking at the $STABLE rally within a range context
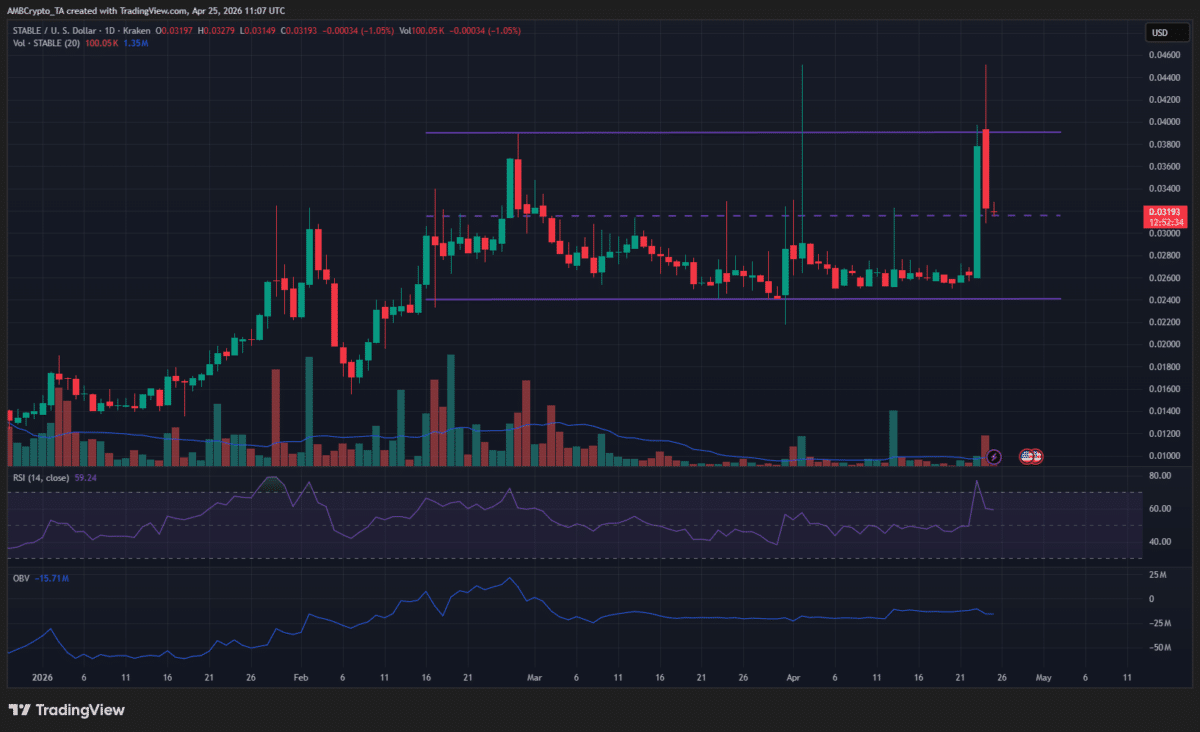
The range (purple) extended from $0.024 to $0.039, with the mid-range resistance at $0.0316. The $0.039 high, set in late February, has not been breached yet. That is, a daily session close above this local high has not yet occurred.
Combined with the swift rejection from the $0.04 supply zone, it appeared likely that $STABLE prices would trend back toward the $0.024 range lows next.
The OBV was moving higher, but the trading volume has not been consistent. There have been low-volume days interspersed with high trading volume and high volatility days.
Hence, though the RSI reflected upward momentum, buyers should stay cautious.
Traders’ call to action: Prepare for consolidation
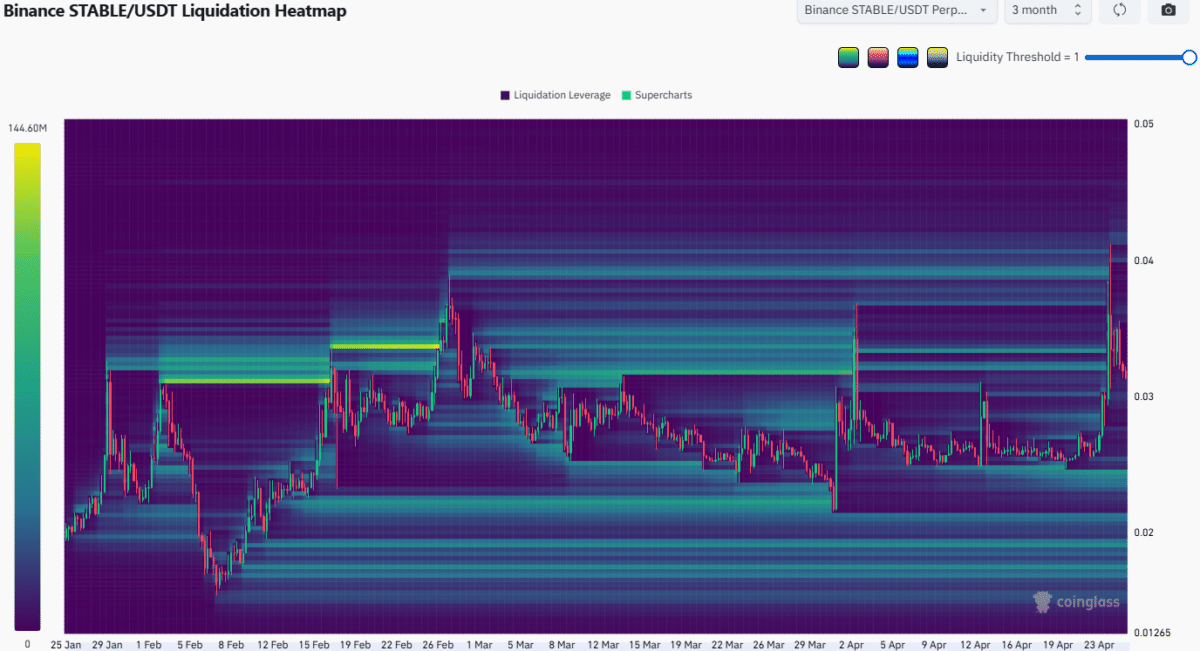
The 3-month liquidation heatmap showed a pattern. After hunting down the liquidity around $0.034 in late February, $STABLE pushed a little higher before receding to the $0.022 magnetic zone.
On the way down, the consolidation in the first half of March built up short liquidation of $0.0315-$0.0345, which was once again hunted down in early April.
In summation, $STABLE has a habit of volatile price moves toward key liquidity clusters, followed by a reversion toward the opposing magnetic zone.
At the time of writing, this opposing magnetic zone sat at $0.0245.
Traders can expect a downtrend toward this level, which lined up well with the range formation. On the way down, some consolidation and a bounce to sweep the overhead short liquidations is a possibility.
Final Summary
- Increased stablecoin adoption and more usage were likely factors behind the rising $STABLE prices recently.
- The liquidation heatmap and the range formation suggested that the recent gains could slip from the bulls’ grasp.


