


 6
6
$XRP currently trades within a tightening triangle after the recent relief bounce, but a breakout could ensue within the next few weeks.
$XRP has struggled to maintain its upward momentum following the recent relief bounce that coincided with a broader market recovery. As of press time, the value has stalled at $1.42 amid slowing momentum, with price action staying tight over the past few days.
Key Points
- $XRP has stalled at $1.42 after a relief bounce amid continued range-bound price action.
- A symmetrical triangle has formed since the $1.11 low in February 2026.
- The triangle apex suggests a likely breakout window between mid and late May.
- A confirmed breakout could target the $1.70-$1.80 resistance zone.
- Loss of support may push $XRP back toward $1.12 levels.
$XRP’s Triangle Formation
Market analyst Chart Nerd called attention to this structure in a recent video commentary. Looking at the daily chart, $XRP continues to trade within a narrowing range.
Chart Nerd explained that the price is moving between a downward-sloping resistance line and an upward-sloping support line. This pattern has been forming for months, especially since $XRP recovered from its February 2026 low of $1.11, leading to a symmetrical triangle.
Possible Breakout Timeline
The analyst noted that the triangle is nearing its apex, with price action expected to reach a key point between the middle and end of May. According to Chart Nerd, a breakout could happen sooner in either direction, but for now, there is no clear confirmation of where the trend is heading.
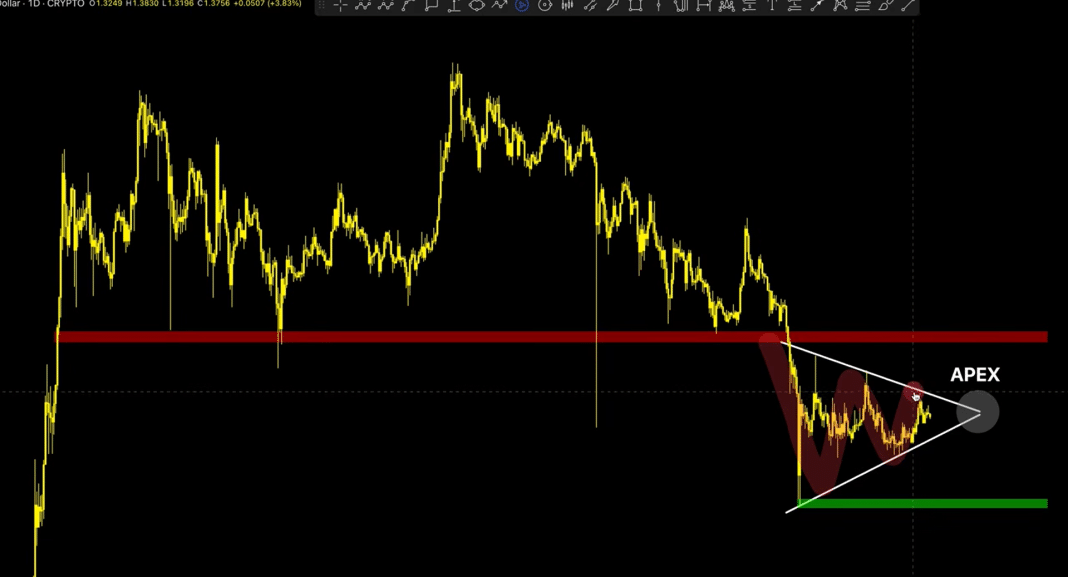
He pointed out that for a true bullish signal, $XRP needs to break above the resistance trendline around $1.50 and then hold that level as support. Without this playing out, any move upward remains uncertain.
If buyers manage to push through, the next target sits in an important zone around $1.70 to $1.80. For context, $XRP once stayed above $1.80 for over 400 days, which makes the $1.70 to $1.80 range a strong resistance area now, even though it previously acted as support. If $XRP moves higher, this range could act as a short-term target and a major turning point.
$XRP Still Faces Downside Risk
However, the structure also carries risks on the downside. Chart Nerd highlighted the series of higher lows forming along the support line. If the price keeps tightening but then breaks below this support and confirms it as resistance, a sharp drop could follow.
In that case, $XRP could fall back toward $1.12, which matches the earlier lows where the current pattern began. This makes the ongoing squeeze toward the triangle’s apex especially important, as it will likely decide the next major move.
Besides the short-term pattern, Chart Nerd also noted that since $XRP reached its all-time high of $3.6 in July 2025, the price has continued to form lower highs, showing that the overall trend remains bearish. This pattern is still visible even within the current triangle.
He also referenced $XRP’s push from $1.80 to $2.4 in early January 2026 before it later pulled back. This shows that even if $XRP breaks out now, it could still form another lower high before turning down again. As a result, he advised investors to remain cautious instead of assuming a strong upward trend will follow soon.

