


 15
15
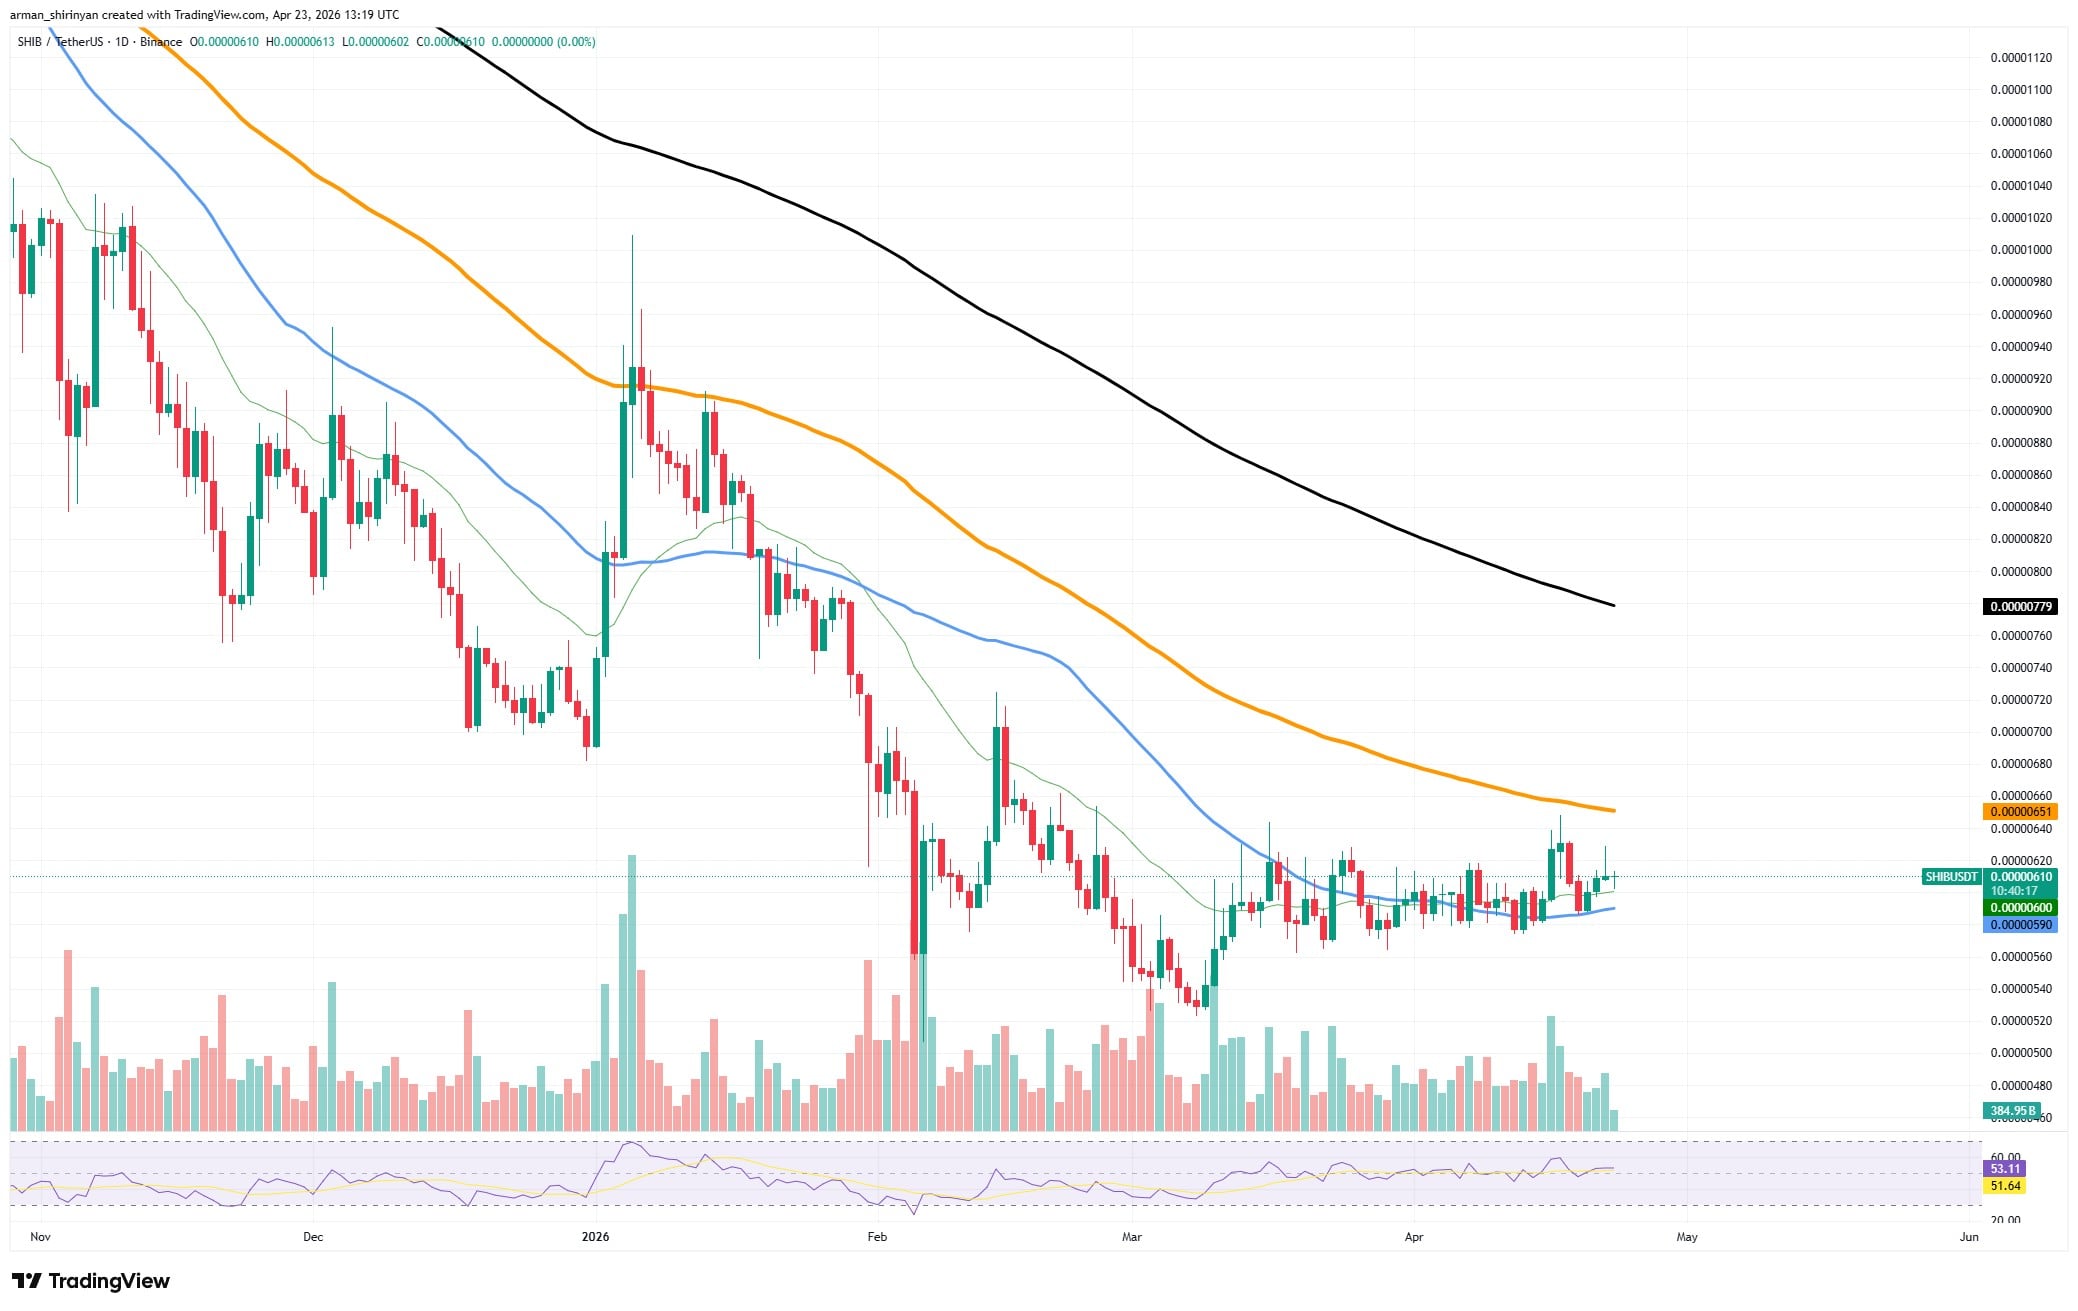
After months of continuous downward pressure, Shiba Inu is exhibiting structural stabilization. Instead of printing aggressive lower lows on the price chart, $SHIB has moved into a tight consolidation range that is slightly above recent local support. In the absence of confirmation from volume and wider market participation, this type of compression usually indicates seller exhaustion rather than a bullish continuation.
Shiba Inu breaks the threshold
Currently, the on-chain activity is more noticeable. With about 86 billion tokens successfully removed from centralized exchanges in a 24-hour period, $SHIB recorded a significant negative netflow according to CryptoQuant-style metrics. More tokens are being withdrawn than deposited, as indicated by netflows deep in negative territory (-108 Billion range).
Since assets are being transferred into private wallets rather than set up for liquidation on exchanges, this typically indicates less immediate sell pressure.
This narrative has been reinforced by a slight decline in exchange reserves. In general, lower reserves restrict the amount of supply available on trading venues, which can magnify price movements if demand increases. However, timing is crucial, and the market currently lacks strong directional conviction, so this by itself cannot ensure upside.
Influx of fresh inflows
A closer look reveals that while both exchange inflow and outflow metrics are high, outflows predominate. This implies active repositioning as opposed to passive holding. In the meantime, there has been a slight increase in active address data, but not to the extent that would suggest a significant influx of new participants.
This configuration produces a conditionally bullish situation from a forward-looking standpoint. A sharper-than-expected breakout could occur if $SHIB is able to combine declining exchange reserves with an increase in demand, particularly from retail flows returning to memecoins. On the other hand, even though the outflow data appears bullish, the asset is likely to stay range-bound if volume stays stagnant.
Hype around Hyperliquid
Hyperliquid is getting closer to a technically precarious area, where directional conviction is beginning to thin out and momentum is waning. The asset moved into the low-$40 range following a robust recovery from sub-$30 levels, but recent price action indicates that the rally is waning rather than picking up speed.
With a rising trendline and a position above important short-term moving averages, $HYPE continues to be in a short-term uptrend on the daily chart. The structure is starting to compress, though. The price is now forming a series of tentative pushes into resistance around the $43-$45 region, rather than making clear higher highs. Usually, this type of behavior indicates fatigue rather than persistence.
At first glance, the RSI may appear neutral, as it is in the mid-to-high range without clearly entering overbought territory. In actuality, it indicates a lack of significant bullish pressure, buyers are still there, but they aren't forceful enough to propel a clear breakout. However, sellers also lack total control.
Volumes are changing
Volume backs up this theory. The level of trading activity has decreased since the initial breakout phase. Seldom is lower volume a bullish indication during consolidation close to resistance. It frequently comes before a rejection or a prolonged sideways range, particularly in situations where the general state of the market is not very encouraging.
Moving averages show that the macro trend recovery is still ongoing, because the 200 EMA is still much lower than the 100 EMA, which is beginning to flatten below price. The structure may rapidly deteriorate into a deeper pullback if $HYPE is unable to stay above the short-term trendline and falls below the $38-$40 support area. However, worse does not always equate to a complete reversal.
$XRP's recovery possibility rises
The formation of a short-term moving average crossover on the daily chart is one of the more overlooked developments in $XRP's early technical signals of a possible recovery. When verified by price action, this setup frequently precedes changes in short-term momentum. The 26 EMA is currently pushing into the 50 EMA from below.
The price of $XRP has stabilized and started to form a base following a protracted downtrend that pulled it toward the $1.30 area. The balance between buyers and sellers during this crucial sideways accumulation phase indicates that aggressive downside pressure has subsided.
Context, however, matters. Both the 100 and 200 EMAs, which are still sharply sloping downward, are still above where $XRP is trading. Therefore, any bullish signal from shorter-term averages should be interpreted as an early-stage development rather than a confirmed reversal, as the macro structure remains bearish. In other words, this is not yet a change in trend, but rather a change in momentum.
$XRP is continuously testing nearby resistance while remaining in the mid-$1.40 range, failing to make a clear breakout. Although buyers are intervening, they are not yet powerful enough to move the asset into a higher trading range, as evidenced by the lack of strong follow-through.
Volume adds a layer to this analysis. In contrast to the steep decline earlier in the year, activity has been comparatively muted. Moving average crossovers can become less reliable if there isn't a significant increase in volume, because there isn't enough market participation to support them.
Still, it's worthwhile to watch this setup. A wider recovery phase may be initiated if $XRP is able to maintain above local support and the 26 EMA clearly crosses above the 50 EMA with increasing volume. The next significant test would be the 100 EMA if higher resistance zones were successfully regained.