


 16
16
The cryptocurrency market has turned bullish following a poor start to the week.
Bitcoin, the leading cryptocurrency by market cap, is up by nearly 2% in the last 24 hours and now trades above $76,000.
Solana’s $SOL is also up by 1% and is now trading at $85.8 per coin.
$SOL could rally higher in the near term as positive sentiment around $SOL builds, driven by rising institutional demand for $SOL spot Exchange Traded Funds (ETFs).
Furthermore, Lily Liu, President of Solana Foundation, emphasized that $SOL’s architecture is designed around unified liquidity, highlighting its long-term strength as financial infrastructure for global-scale adoption.
$SOL eyes breakout amid growing institutional demand
$SOL is up by 1% in the last 24 hours and looks to break out above the $87 Transactional Liquidity (TLQ) level in the near term.
The rally could be fueled by growing institutional demand.
According to CoinGlass, spot Solana ETFs recorded inflows of $3.28 million on Monday, following $35.17 million last week and marking the fifth consecutive day of inflows.
If this inflow continues and intensifies, $SOL could rally higher over the next few days.
The derivatives data also indicate that retail traders are taking up more positions in the market. CoinGlass data shows that $SOL’s funding rate data flipped positive on Monday and now reads 0.0068% on Tuesday.
This indicates that longs are paying the shorts, highlighting bullish sentiment.
In addition to this, Lily Liu, President of Solana Foundation, stated in an interview at the Solana Policy Institute’s Washington x Wall Street Summit that Solana’s architecture prioritizes unified liquidity.
She pointed out that markets are ultimately driven by liquidity, and the largest, most efficient pool of capital will always dominate.
With the internet connecting nearly 5.5 billion people globally, Liu believes that Solana’s architecture is designed to support the largest possible marketplace on a single network.
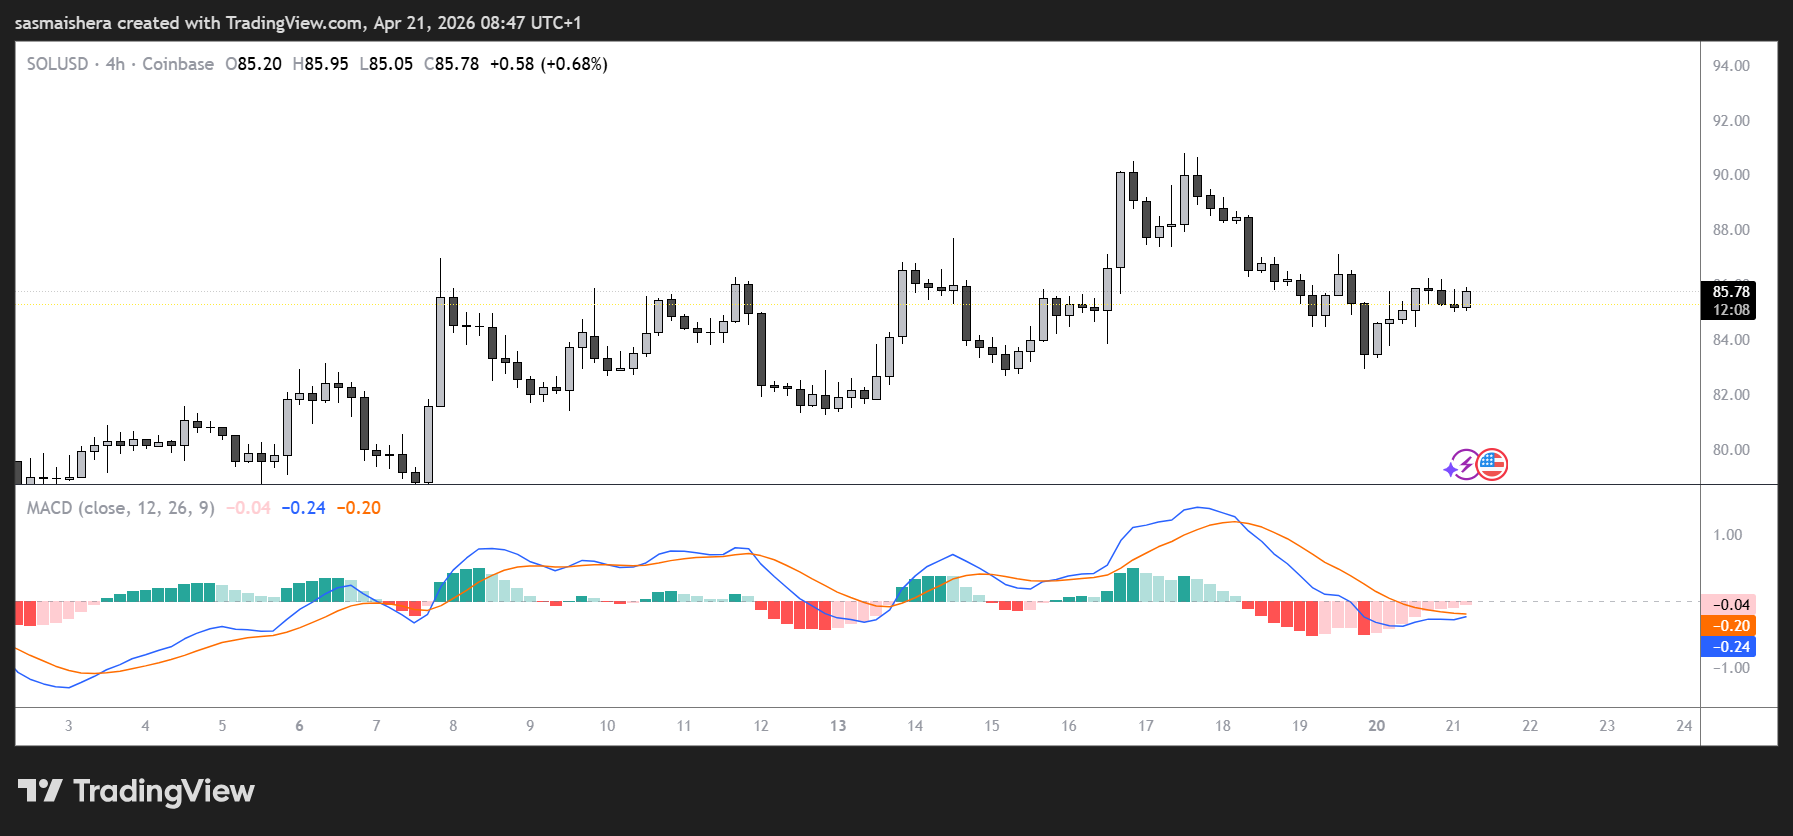
$SOL eyes breakout above $87
The $SOL/USD 4-hour chart is bearish and efficient, but could soon flip bullish as $SOL is approaching a key TLQ level.
It is currently trading at $85 and is approaching the key 50-day Exponential Moving Average (EMA) at $87.10, where a close above suggests a bullish move.
The next major resistance stands around the $92.11 region.
The Relative Strength Index (RSI) on the 4-hour chart holds close to the midline around 50, hinting at neutral momentum.
The Moving Average Convergence Divergence (MACD) stays positive but moderates, suggesting only a tentative recovery within a broader capped structure.
If the bulls push harder, $SOL could surge past the 50-day EMA and 4-hour TLQ at $87.10 over the next few hours or days.
A daily candle close above this level would be needed to ease immediate downside pressure.
Above this 50-day EMA is the next resistance level at $92.11.
An extended rally would expose the 100-day EMA at $97.06 and the 38.2% retracement at $98.53 in the near to medium term.
However, if the sellers regain control, $SOL could retest the weekly low of $82.82 over the next few hours.
