


 22
22
A pivotal technical moment that could determine Bitcoin's course for the upcoming months is quickly approaching. The 100-day EMA has emerged as the most important barrier, as Bitcoin attempts to recover important structural levels following a protracted downtrend and a dramatic correction earlier this year.
Bitcoin's inability to break through
A distinct bearish structure has given way to a compression phase in price action, creating a tightening triangle pattern. This configuration usually precedes a breakout, but the price's response to overhead resistance will determine the direction.
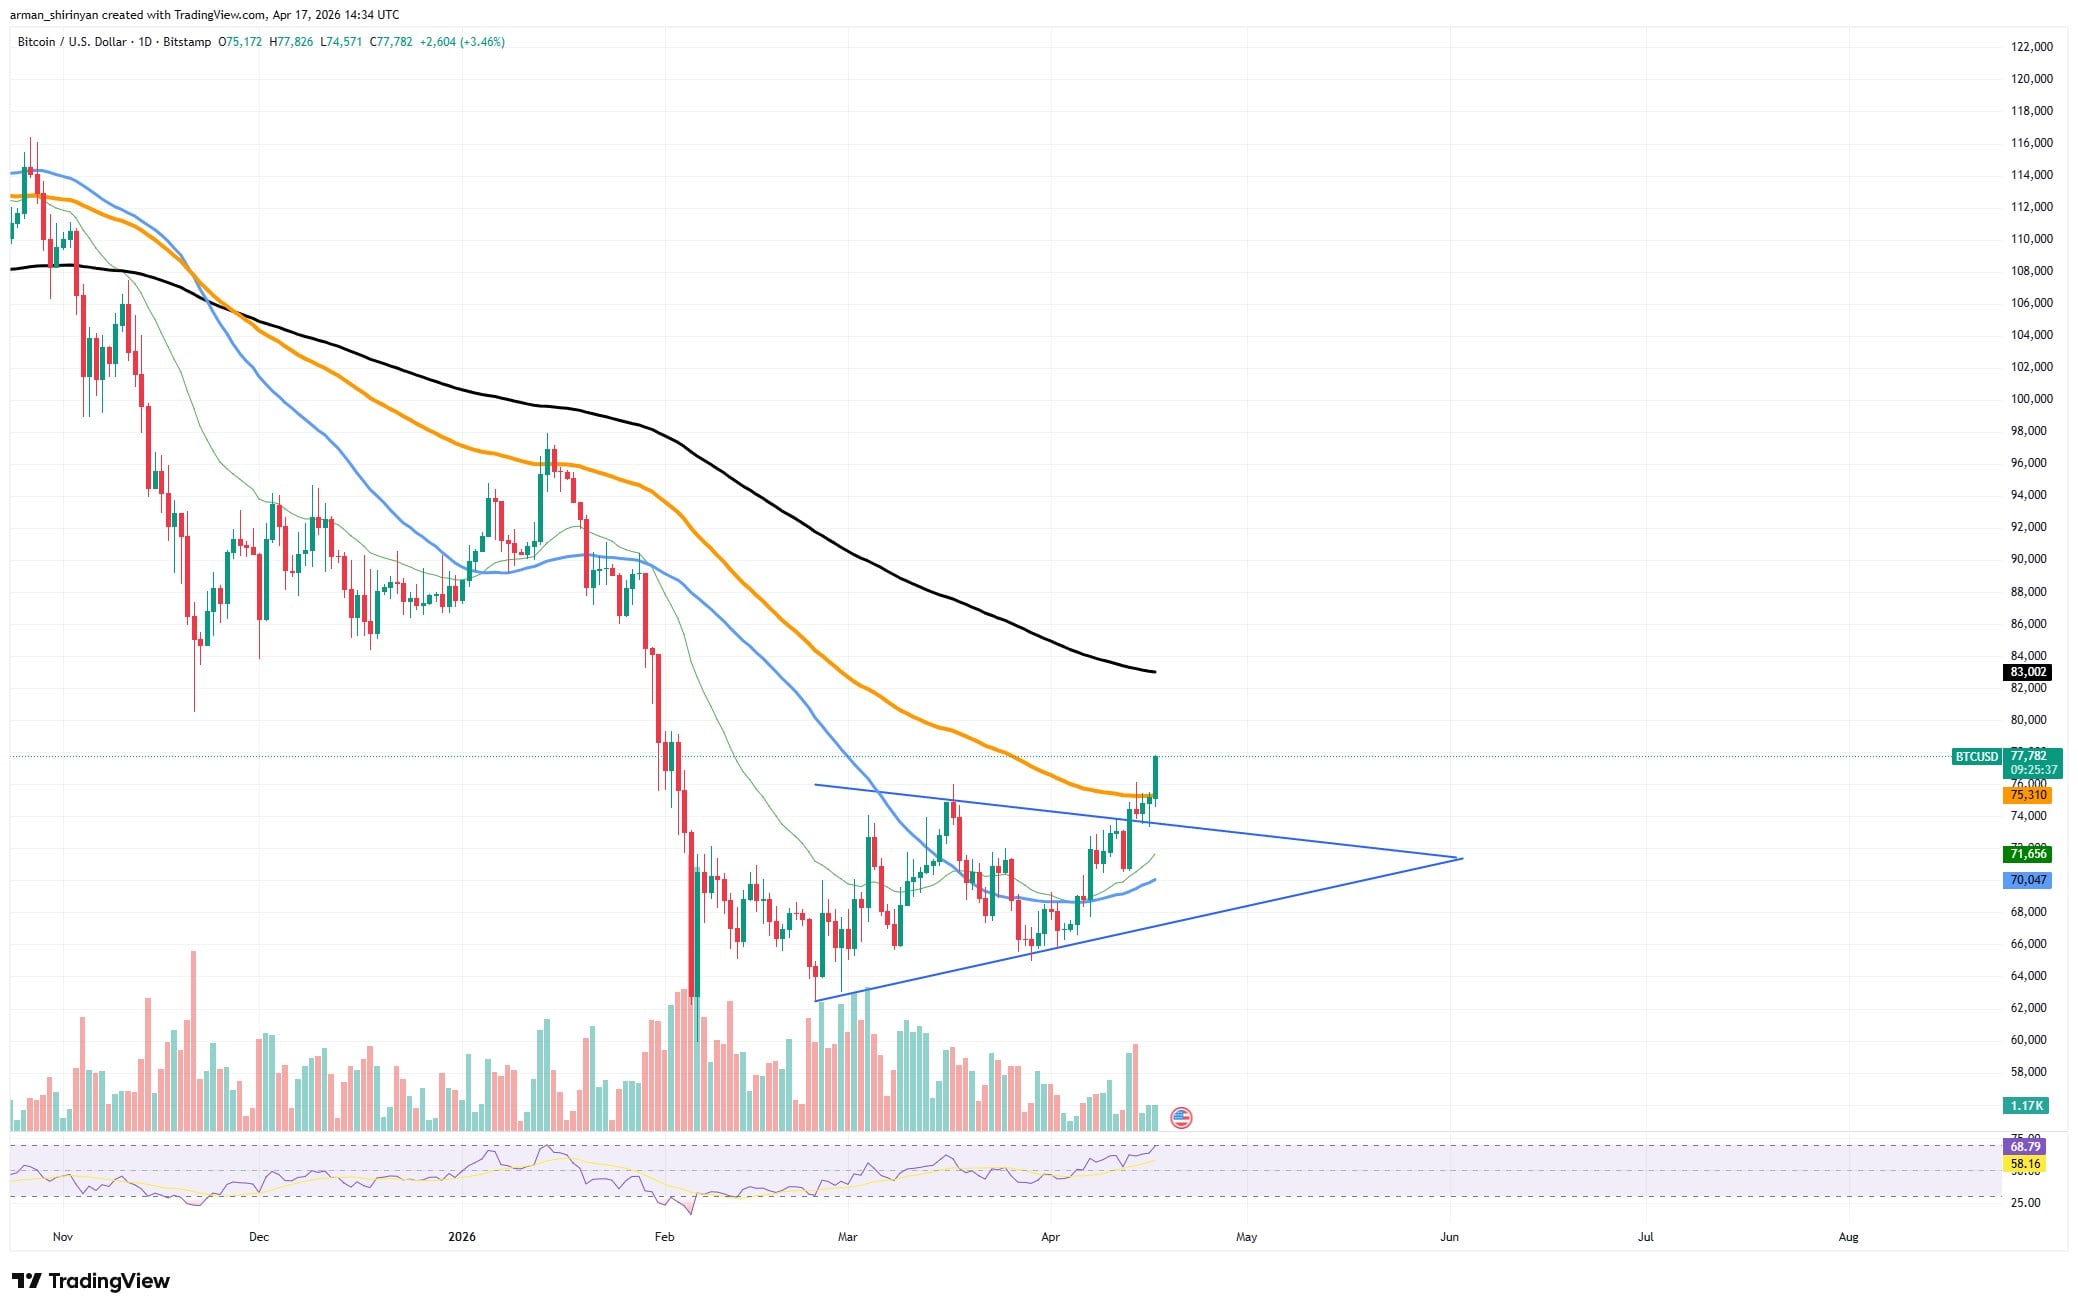
At the moment, Bitcoin is testing the 100 EMA from below and pushing against the upper boundary of that formation. This level is a medium-term trend filter, not just another moving average. $BTC has continuously failed to recover it during the recent decline, and each rejection has resulted in additional declines.
100 EMA break possibility
A verified break above the 100 EMA would indicate a structural change, meaning that buyers are taking back control of the market and bearish momentum is waning. Indicators of momentum are already pointing in that direction.
While volume has begun to increase during upward movements, RSI is moving into bullish territory, indicating growing buying pressure. Although it usually encourages breakout attempts, this combination does not ensure continuation until all resistance has been overcome.
In general, the market is still unstable. Bitcoin remains below the 200 EMA, which continues to trend downward, reinforcing the idea that the macro trend has not yet reversed.
Because of this, the current test is even more crucial because, should $BTC fail, the rejection could push the price back toward the triangle's lower edge and possibly start another selling wave.
However, there are serious ramifications if the breakout continues. Regaining the 100 EMA would pave the way to higher resistance levels and probably spur fresh market activity, especially on altcoins that depend on the directional strength of Bitcoin.
Ethereum pursuing major goals
Ethereum's price is pushing straight into the 100-day EMA, one of the most significant resistance zones in the current market structure, as it approaches a crucial turning point. $ETH is currently testing what can only be called a ceiling that has continuously limited upside attempts after weeks of a slow recovery from its February lows.
A distinct change in momentum can be seen in the recent price action. With the help of improving short-term moving averages and growing buying pressure, Ethereum has been hitting higher lows and continuously rising.
$ETH has returned to the $2,400-$2,500 range, where the 100 EMA is currently located, thanks to this recovery phase. But even though there was a brief push above this level, the move is unconfirmed.
Violation not a breakout
That distinction is important. There has only been a violation of the 100 EMA, not a complete break. Although the price is close to it, this is still more of a test than a breakout in the absence of a clear close above and follow-through.
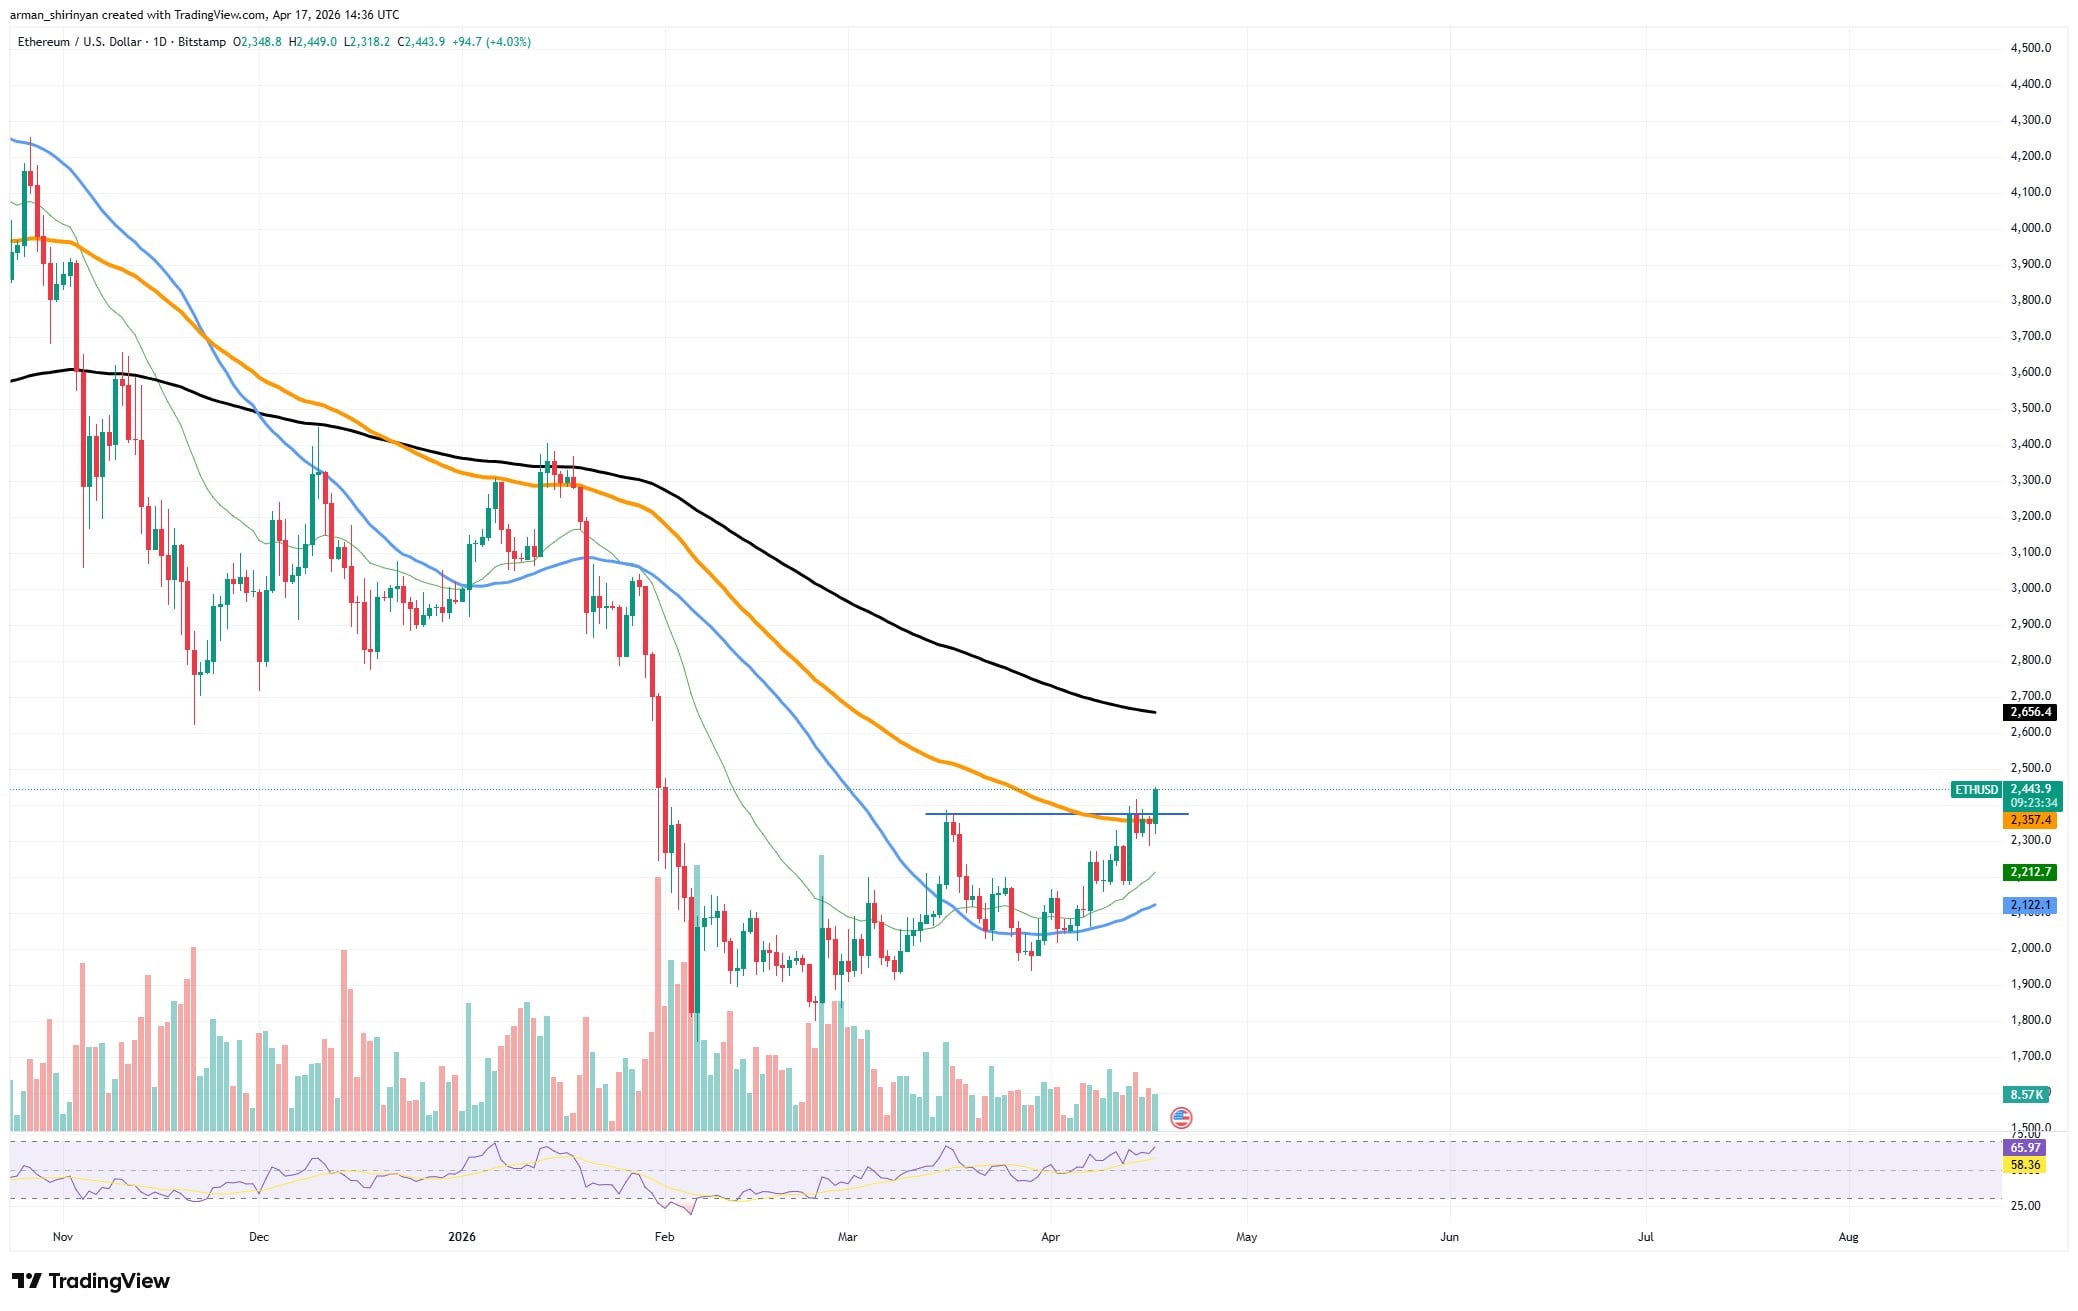
In the past, Ethereum has experienced difficulties at this precise level during downtrends, frequently being rejected before falling further or going into prolonged consolidation. The present is crucial because of this.
Ethereum would essentially move out of recovery mode and into the early phases of a sustained uptrend if there were a verified break above the 100 EMA. Additionally, it would pave the way for the next significant barrier, the 200 EMA, which represents the larger trend reversal zone.
Tension is highlighted by momentum indicators. Although the RSI is rising and reflecting increased demand, it is not yet at levels that indicate a strong bullish continuation. Although volume has increased, it is still insufficient to confirm a clear breakout.
Ethereum is practically on the verge of a change in regime. Whether the current recovery develops into a trend reversal or fades back into consolidation depends on the difference between a breakout and another rejection.
$XRP's market acceleration
The long-term decline of $XRP is beginning to end, and the current price structure indicates that the asset is about to enter a stage where acceleration is feasible. $XRP is currently forming a rounded bottom after months of lower highs and ongoing selling pressure.
If confirmed, this is a classic reversal pattern that frequently precedes stronger upside moves. The price has recently moved away from its consolidation base and toward the $1.45-$1.50 range, breaking above short-term resistance.
A series of higher lows since February supports this move, suggesting that buyers are gradually taking charge. The claim that bearish momentum is waning is strengthened by the breakout above the downward trendline.
$XRP's long-term future unclear
Technically, $XRP is still below its main long-term resistance levels, especially the declining 100 and 200 EMA. The distance between the price and those indicators is getting closer, though.
Reversals usually start with compression and a slow recovery of lost territory rather than an instant breakout. Acceleration is crucial in this situation. A rounded bottom alone does not ensure a parabolic move, but it does set the stage for one.
The structure will change from recovery to expansion if $XRP can continue on its current course and break through the next resistance zone close to the 100 EMA. At this point, momentum feeds on itself, and sidelined capital begins to reenter, making parabolic behavior possible.

