


 16
16
Monad has formed a triple top on lower timeframes, raising concerns of further short-term weakness. What is the possible target?
While other altcoins are showing signs of recovery, Monad ($MON) is correcting. Over the past 24 hours, the coin has dropped over 7% to $0.0336 after failing at a crucial price level again.
Notably, this move began recently. While $MON is down 7% in the past seven days, it has increased by 38% over the last 30 days and 46% since the start of the year.
Accompanying this price pullback is a drop in trading volume. In the past 24 hours, trading volume has declined by 3% as market participants prefer to stay on the sidelines and observe Monad’s price trend.
$MON Price Analysis: Triple Top Formation
An analysis of the 4-hour chart calls for greater concern about Monad, as a triple top appears to have formed. A string of price developments in the past few days led to this structure, which, from a price standpoint, does not look too good for near-term trends.
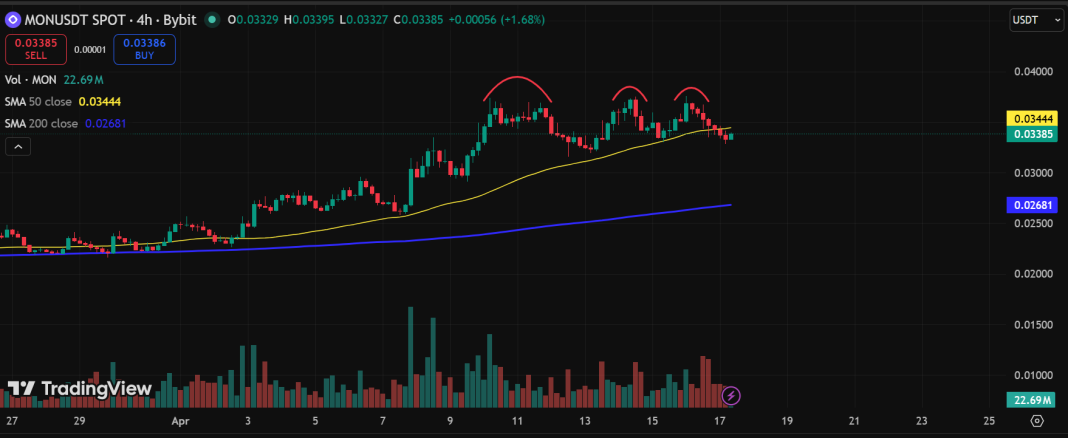
The first top started forming on April 10, after a high of $0.0373. The coin consolidated around this area and then tried another breakout the next day. However, $MON peaked at $0.0369, completing the first top formation.
After a wave of sideways price trends, $MON attempted to break higher again. It peaked at $0.0374 on April 14, forming the second top. Prices were rejected around the same level, and Monad trended lower but tried again a few days later.
On April 16, it rallied again to an intraday high of $0.0375. The token met strong selling supply again and still couldn’t overcome it. From the high, Monad has dropped 10% to its current price level.
Triple tops suggest that an asset has not gained sufficient price momentum to forge ahead to higher prices. Repeated attempts to break above a resistance area have been met with strong rejection, and most of the time, the coin retests lower levels.
Key Moving Average Reinforces Bearish Outlook
The recent rejection and subsequent bearish trend have seen $MON break below the 50-period moving average. The dynamic trendline sits at $0.0344, below the current price of $0.0336. More interestingly, this moving average has previously served as support for the coin during earlier rejections.
The pullback from the first and second top rejections found support around the 50 MA, but this time the coin has broken below it. Losing this dynamic support increases the risk of a drop to lower prices. The previous day also crossed with a shooting star candlestick, another bearish confirmation.
Meanwhile, the downward target is the 200 MA at $0.0268, representing a 20% correction from the current level. Breaking above the resistance around $0.0375 would invalidate this move and turn momentum bullish again.
Monad On-Chain Data
Derivative data shows caution among traders towards Monad. Open interest has dropped 8% in the past 24 hours to $140.77 million, and futures flow reinforces the loss in appetite among futures traders.
Outflows have outpaced inflows, showing that more futures contracts have been closed in the past 24 hours than opened. Futures volume has dropped nearly 20% to $116.5 million, reflecting the deleveraging.
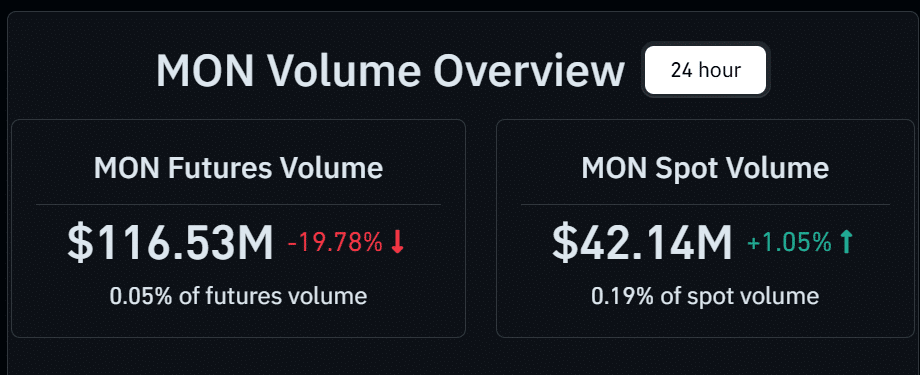
Meanwhile, spot volume has increased slightly in the same timeframe to $42 million, with a taker sell of 53% suggesting that a majority of this volume is selling pressure.


