


 19
19
The Cardano price is struggling to replicate the form seen in Bitcoin and Ethereum, with the 50-day moving average serving as key resistance.
At the time of writing, Cardano ($ADA) changes hands at $0.243, up 2.12% in the past 24 hours. While this is an admirable move, given that it closed very poorly last week after an over 5% drop on Sunday, $ADA has failed to match the momentum recorded by other assets.
For perspective, the 2% rise is conservative compared to the 5.64% and 9% growth witnessed by Bitcoin and Ethereum over the same timeframe. The gap in performance widens even more on higher timeframes. $ADA has remained almost unchanged in the past 7 days, while $BTC has increased by 8.7% and ETH by 13.2%.
This trend is notable for Cardano, as it appears to be depegging from two of the largest cryptocurrencies by market cap. Bitcoin has broken out to reclaim $74,500, and Ethereum has served as a higher-leverage beta play for the premier crypto asset, reaching $2,388. However, all $ADA, like most other altcoins, could do is consolidate.
Cardano Price Analysis
A look at the daily chart shows why that could be the case for $ADA. Both $BTC and Ether have broken above the 50-day simple moving average (SMA), but that is not the case for the “Ethereum killer.”
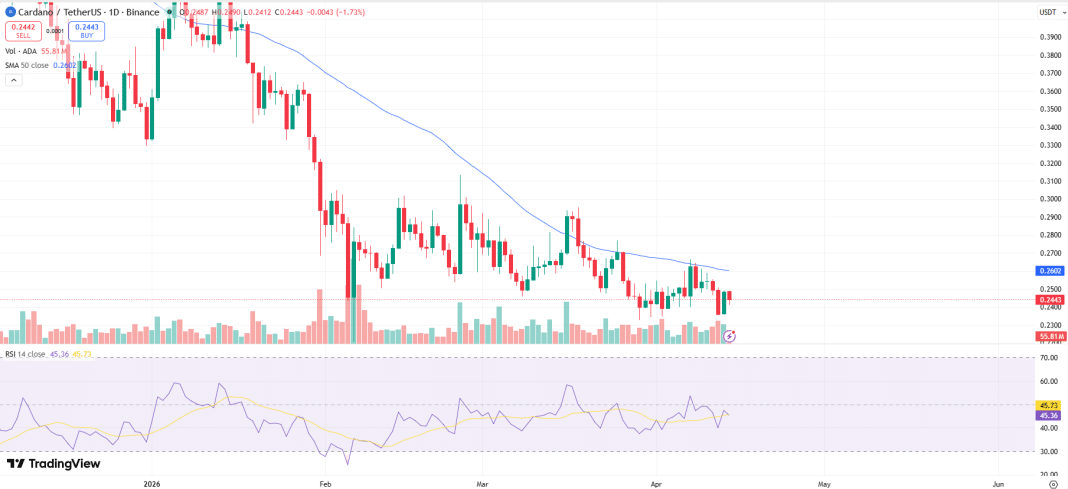
The current Cardano price of $0.243 lies below the 50D SMA at $0.260. Notably, this dynamic trendline is crucial, as it serves as a borderline for price trends. Trading below it reinforces bearish trends, while a break above shifts momentum to the bullish side.
Interestingly, $ADA has failed to sustainably trade above this MA since early October 2025. While it did between July and August 2025, its price rose 52% from $0.67 to $1.019. However, since breaking below in October 2025, its price has dropped by 70%, from $0.819 to the current level.
As a result, breaking above the 50-day moving average resistance could be the gamechanger for $ADA. Until this occurs, bears are still in control, and the coin could continue to underperform against Bitcoin and Ethereum.
Cardano On-Chain Metrics Support Bears
Meanwhile, Cardano could be reacting to negative on-chain metrics. While trading volume has increased over the past 24 hours, open interest has dropped slightly, signaling the futures market’s disinterest in $ADA.
Cardano futures flows further highlight this trend. Specifically, $207.5 million has flowed into derivative contracts in the past 24 hours, while $211.1 million has flowed out, suggesting that traders closed more futures positions in dollar terms than they opened during this period. A combination of dwindling OI and futures flow suggests traders are looking elsewhere for stronger price momentum.
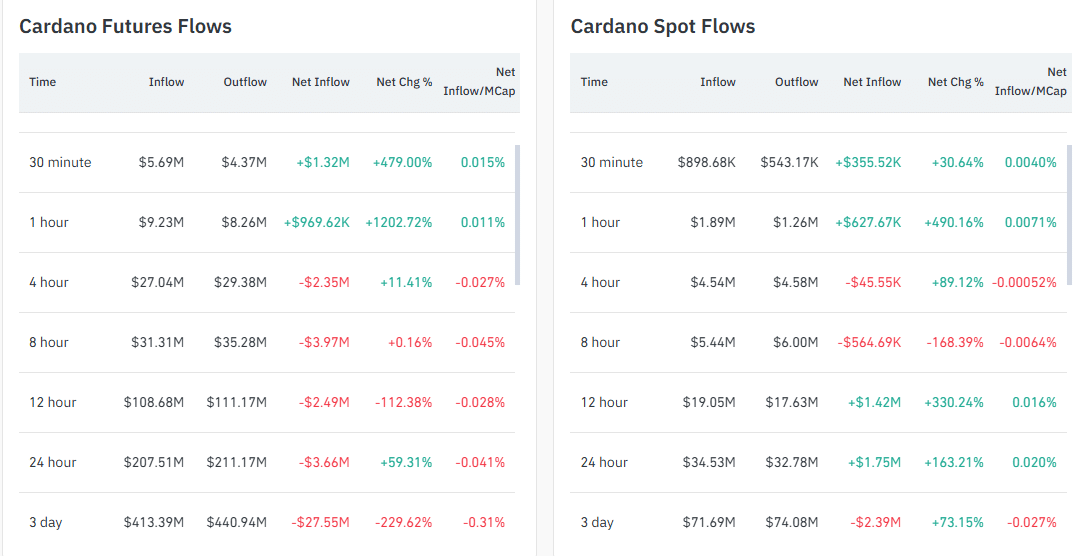
Spot flows also do not look good for $ADA. Over the past 24 hours, holders have moved more of the token to exchanges, possibly for sales. Inflows stood at $34.53 million and outflows at $32.78 million, reflecting this trend. Such activities add selling pressure, further resisting Cardano’s price.
