

 6
6
$SOL trades at $82.33 on April 13, up 0.51%, holding just below the 0.382 Fib at $82.50 as spot ETF inflows return and Solana treasury stocks continue collapsing with no floor confirmed yet.
$SOL 4H Chart: 0.382 Fib At $82.50 And SAR At $85.86 Are The Two Levels To Watch
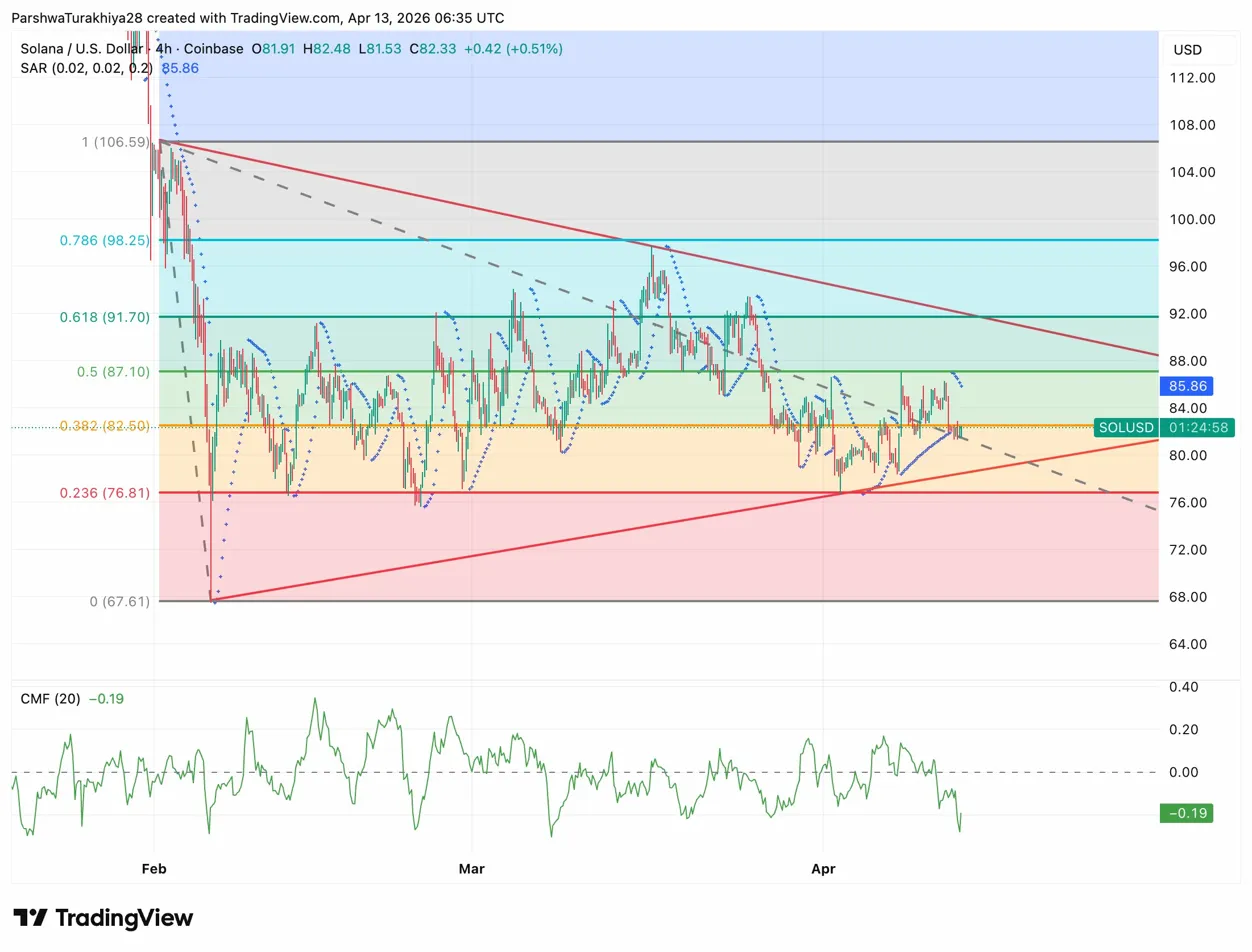
The 4H chart shows a Fibonacci retracement from the February low at $67.61 to the swing high at $106.59, with price sitting just below the 0.382 level at $82.50. The descending channel from the March high continues to compress price, upper boundary near $88.00, lower boundary rising toward $78.00.
Related: Cardano Price Prediction: Protocol 11 Hard Fork Stays On Track Despite Fix
The SAR at $85.86 sits above as the next resistance after $82.50. The CMF at -0.19 keeps money flow negative, meaning buyers have not taken control despite the small bounce. A 4H close above $82.50 and then $85.86 opens the 0.5 Fib at $87.10, then the 0.618 at $91.70. Below, the 0.236 Fib at $76.81 is the next floor, with the February low at $67.61 as the line below that.
Key levels for April 14:
- 0.382 Fib resistance: $82.50
- SAR resistance: $85.86
- 0.5 Fib: $87.10
- 0.618 Fib: $91.70
- 0.786 Fib: $98.25
- 0.236 Fib support: $76.81
- February low: $67.61
Solana Treasury Stocks Are Down 80-90% And TedPillows Sees More Pain Ahead
Solana Treasury companies are looking like Solana memecoins.
— Ted (@TedPillows) April 12, 2026
They are already down 80%-90%, but could go down another 30%-50% before the bottom. pic.twitter.com/WmSHV0s5th
Analyst TedPillows posted a four-panel chart showing Sol Strategies, Sharps Technology, DeFi Development Corp, and a fourth Solana treasury holding all down 80-90% from their peaks, with no base-building visible in any of them. His warning: another 30-50% drop is possible before a bottom forms.
These are publicly traded companies that accumulated $SOL as a treasury asset, and their charts now trade like speculative tokens rather than equities. That matters for $SOL directly. Corporate conviction in the ecosystem is under pressure at the same time price is trying to hold the 0.382 Fib, and the two narratives work against each other heading into April 14.
$SOL Spot ETFs Snap The Outflow Streak With $11.45M On April 10
After outflows of $15.40M on April 7 and $1.92M on April 8, $SOL ETFs flipped to $11.45M in inflows on April 10, entirely from Bitwise’s BSOL.
Total net assets sit at $827.71M with cumulative inflows at $974.68M, just short of the $1B mark. Morgan Stanley announced plans to explore tokenization in the crypto space, keeping the Solana institutional narrative alive alongside the ETF recovery.
$SOL Price Prediction: April 14 Outlook
- Upside: 4H close above $82.50 clears the 0.382 Fib, SAR at $85.86 is next. CMF turning positive confirms the money flow shift. ETF inflows holding above $10M per day adds weight. First real target above the SAR is $87.10, then $91.70.
- Downside: $82.50 holds as resistance, CMF stays negative, and $SOL slips toward the 0.236 Fib at $76.81. Treasury stock collapse continuing to accelerate keeps sentiment heavy. A 4H close below $76.81 opens the February low at $67.61.
Related: Shiba Inu Price Prediction: SHIB Burn Rate Jumps 339% But Three Resistance Layers Block The Breakout
