
 4
4
The current $XRP price action could be presenting a “final opportunity” for investors, according to a prominent market watcher.
$XRP has remained under pressure since Q4 2025, dropping 53% and trading around $1.34. Amid this decline, analyst Chart Nerd believes the asset may be nearing a key turning point, suggesting the current phase could represent a “final opportunity” for investors before the next major move.
Key Points
- $XRP has fallen 53% since Q4 2025, currently trading for $1.34 amid continued market-wide selling pressure.
- The price is now hovering near the Gaussian Channel’s blue regression band around $1.30.
- In past cycles, $XRP has consistently rallied after touching this level.
- Based on this pattern, a potential 40% rally could push $XRP toward the $1.8 to $2 range in the near term.
- Historical trends also show that such rallies are often followed by further declines toward the red regression band, currently near $0.78.
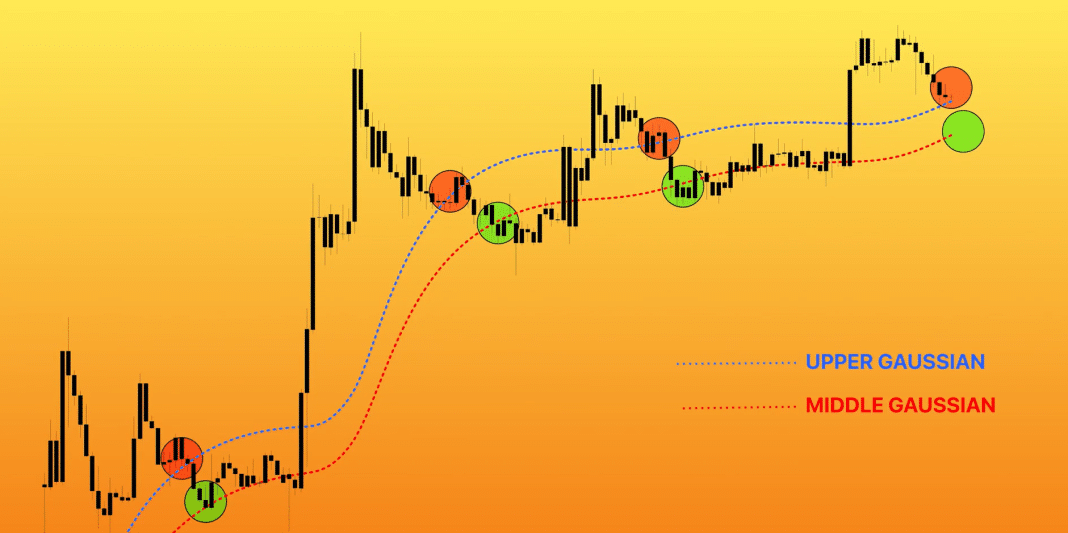
$XRP Gaussian Channel Points to Possible Short-Term Bounce
Chart Nerd based his analysis on the Gaussian Channel, focusing on the monthly chart. He noted that the blue dotted line represents the upper regression band, while the red dotted line shows the middle regression band. He used these levels to assess how $XRP has behaved after past cycle peaks.
According to him, after the 2013 peak of $0.0614, $XRP later dropped back to the blue regression band and made contact with it. The same thing happened after the 2017 peak of $3.31, and again after the 2021 high of around $1.96.
Most recently, after the $3.6 all-time high in July 2025, $XRP has returned to this same blue dotted line and has been hovering around it. Right now, this level is around $1.30 and has acted as a major support area for about three months.
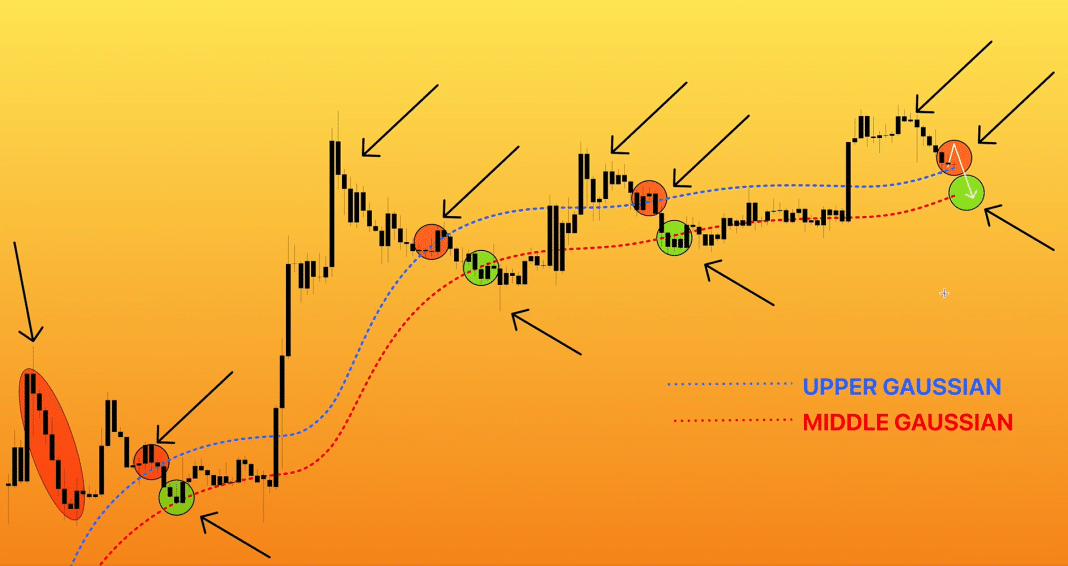
$XRP’s Past Cycles Show a Pattern
Chart Nerd pointed out that each time $XRP has reached this blue level, a short-term rally has followed. In 2015, after returning to the Gaussian band, $XRP stayed above it for about one to three months before rising roughly 110% within two to three months.
However, the rally did not last, as the price formed a lower high of $0.0244, lost support, and then dropped further toward lower levels near the red line.
He said the next cycle showed a similar pattern. Specifically, after staying around the blue band for five to six months, $XRP moved up again, this time gaining about 80% from its local low.
In 2022, the same setup led to a 63% rally before the price declined once more. Based on this repeated pattern, he believes $XRP could now be setting up for another move higher, possibly reaching between $1.8 and $2.
Chart Nerd noted that the size of these rallies has been getting smaller over time, dropping from 110% to 80%, and then to 60%. Following that trend, he expects the next move could be around 40%. From the current level near $1.30, a 40% increase would push $XRP close to $1.8 to $2.
He added that he originally expected this move to happen in March, with a pullback in April. Instead, $XRP has continued to move sideways above the blue line. Even so, he still sees a chance for a rally toward $1.8 to $2 in the coming months.
$XRP Risks Another Drop to $0.78
Despite the chance of a short-term rise, Chart Nerd warned that this could lead to the final stage of the correction.
He explained that in earlier cycles, after bouncing from the blue line, $XRP later dropped to the red middle regression band, where it formed a more stable bottom. At the moment, this red line sits around $0.78, which also supports his target in the $0.70 range.
He also called attention to other factors backing this view, including indicators like the super trend and the monthly and three-month RSI. In addition, he mentioned ongoing global tensions, such as the uncertain situation between Iran and the United States, as a reason why markets remain unstable.

