


 5
5
Solana ($SOL) continues to trade in a fragile range near $82, as analysts highlight conflicting signals across timeframes. While short-term structure suggests downside risk, broader indicators point to a potential shift in momentum. This tension has placed the asset at a critical inflection point, where the next directional move could define its medium-term trend.
Repeating Structure Signals Downside Risk
According to Ali Martinez, Solana has followed a consistent three-phase pattern since October 2025. The cycle begins with a recovery above the 50-day SMA, followed by a failed hold, and ends in a deceptive consolidation phase.
Moreover, this structure has preceded notable declines in previous instances. In November 2025, $SOL entered a sideways range before dropping to a new local low. Similarly, January 2026 showed a brief reclaim, followed by a drift lower.
Currently, $SOL trades below the 50-day SMA near $85.79, while price hovers between $79 and $81. Consequently, this ongoing consolidation may reflect weakening demand rather than stability. If buyers fail to reclaim the $86 level soon, historical behavior suggests a deeper correction toward the $52 region.
Divergence Hints at Momentum Shift
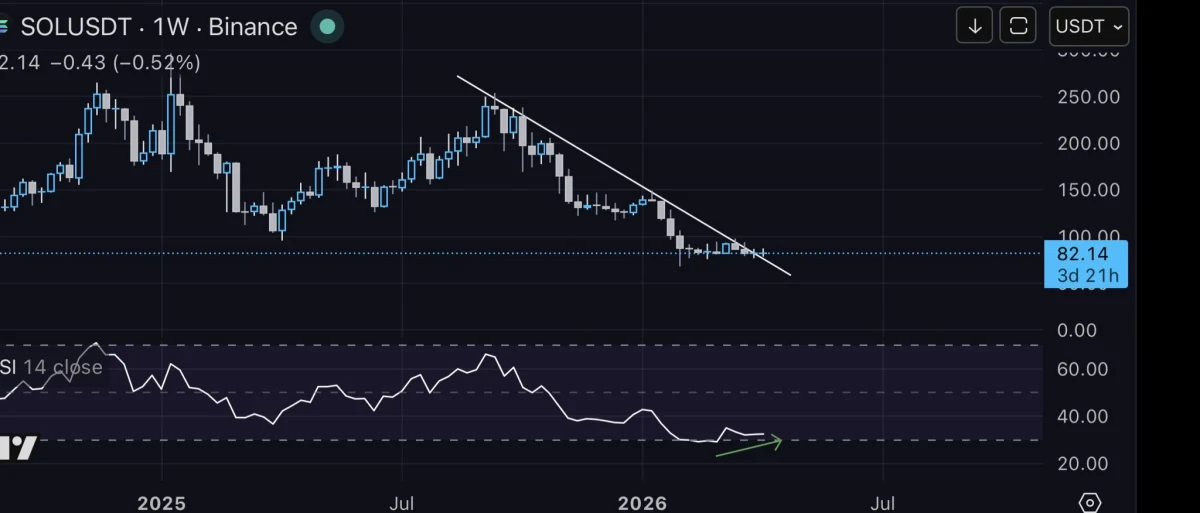
However, a different perspective emerges from sixtysecondalpha, who focuses on weekly indicators. The analyst identifies an exaggerated bullish divergence on the RSI, signaling reduced selling pressure.
Additionally, this divergence could evolve into a stronger reversal signal if momentum continues improving. Price currently holds a key support zone between $80 and $82. Hence, maintaining this level becomes essential for any bullish continuation.
Source: X
A breakdown below $75 would invalidate this setup and expose the $60 range. Conversely, a breakout above $100 would confirm a trend reversal and open the path toward $120 and potentially $140.
Accumulation Phase Builds Breakout Potential
Meanwhile,Illusion X focuses on a broader structural perspective, pointing to accumulation within the $80 to $85 demand zone. Price repeatedly reacts to this level, indicating strong buyer interest.
Furthermore, Solana continues to compress below resistance between $90 and $95. This tightening range often precedes expansion moves. If buyers push price above $95, momentum could accelerate significantly.
Moreover, this structure resembles a classic accumulation-to-expansion pattern. Sustained support could eventually drive a larger rally toward macro resistance levels near $400.
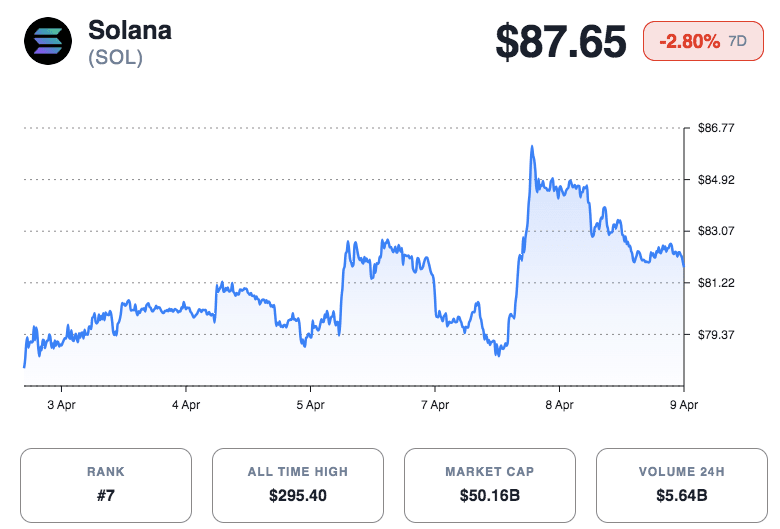
At press time, Solana trades at $82.26 with a slight daily decline. However, weekly gains indicate underlying resilience. Consequently, the market remains divided, with both breakdown and breakout scenarios still in play.