

 3
3
Cardano is deep in the macro corrective phase, but history shows that this period has usually preceded a turning point for the altcoin.
Indeed, Cardano ($ADA) is navigating a prolonged correction, with the price dropping sharply from its peak. The altcoin reached its all-time high of $3.10 in September 2021, but its current price of $0.25 represents a 91.9% decline from that peak.
During this period, sentiments turn negative and interest fades. However, $ADA’s price action is now approaching a critical demand zone that could shape its next major move. Despite continued pressure on lower timeframes, the broader structure suggests a possible base is forming if key levels remain intact.
Key Points
- Cardano ($ADA) is navigating a prolonged correction, with its price dropping 91.9% from the peak of $3.10.
- On the daily chart, an accompanying chart shows that a descending resistance trendline continues to cap upward movement.
- While price action appears bearish, higher timeframes show potential accumulation for Cardano.
- Attention is now on the macro demand zone between $0.13 and $0.18, where $ADA is currently testing.
- Holding above this region would suggest that accumulation may be underway, potentially laying the groundwork for a broader recovery phase.
- A decisive break below $0.13 would significantly weaken prices and potentially lead to deeper downside.
Cardano Price Declines from Prior Highs
An analysis from CoinCodex discussed Cardano’s current price trend and what could happen next. Currently, its price behavior reflects a sustained downtrend, with $ADA consistently forming lower highs and lower lows over several months.
After peaking at $1.019 in August 2025, the coin has steadily dropped, recording declines in every month since. It has fallen by 75% from that peak, demonstrating the strong bear dominance that characterizes bear markets. This type of structure has weighed heavily on sentiment, gradually eroding confidence as repeated recovery attempts have stalled.
Cardano Still Under Pressure on Lower Timeframe
On the daily timeframe, the accompanying chart shows that a descending resistance trendline continues to cap upward movement, reinforcing the bearish tone in the short term. At the same time, technical indicators on the daily chart remain weak.
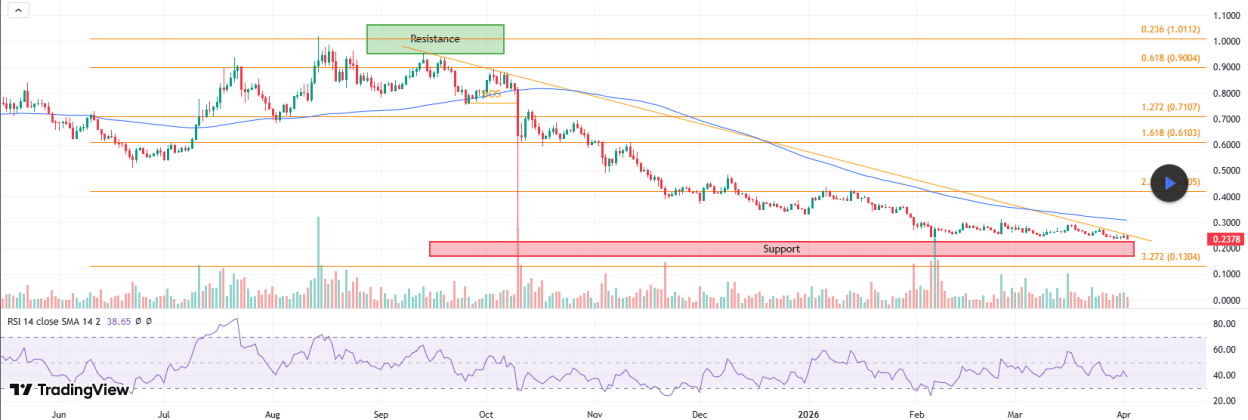
Momentum has yet to shift decisively, and moving averages continue to slope downward, suggesting that sellers still hold control for now. For context, $ADA has failed to decisively break above the 50 MA, currently at $0.26, with attempts earlier in the week failing. It also remains well below the 100 MA at $0.30, reinforcing the bearish structure.
However, while price action appears bearish, zooming out to higher timeframes shows potential accumulation for Cardano. Moreover, its market cap is not in free fall but rather within a range, indicating strength.
Another positive is the recent $ADA classification as a digital commodity. Specifically, the US SEC added Cardano to this category, alongside 16 other cryptocurrencies, a move that confirms its legitimacy.
Key Zone That Could Decide Next $ADA Move
Attention is now on the macro demand zone between $0.13 and $0.18, where $ADA is currently testing. Historically, this range has attracted buying pressure, making it a critical area to watch. Holding above this region would suggest that accumulation may be underway, potentially laying the groundwork for a broader recovery phase.
The accompanying chart shows that holding this support and breaking above the descending resistance opens the way for Cardano to retest the next major resistance around $1.01. This aligns with the 0.236 Fibonacci level and represents a 304% increase from the current market price.
Conversely, a decisive break below $0.13 would significantly weaken prices and potentially lead to deeper downside. As such, how $ADA reacts to this zone would likely determine whether it stabilizes or extends its correction.

