

 4
4
$XRP is trading around $1.37 as crypto markets navigate a complex macro situation, with the announced US-Iran ceasefire offering a brief reprieve for risk assets but failing to spark any meaningful recovery in altcoins. Despite the geopolitical relief, $XRP remains deep in a downtrend and has yet to show the kind of technical signals that would suggest the worst is behind it.
Ripple Price Analysis: The $USDT Pair
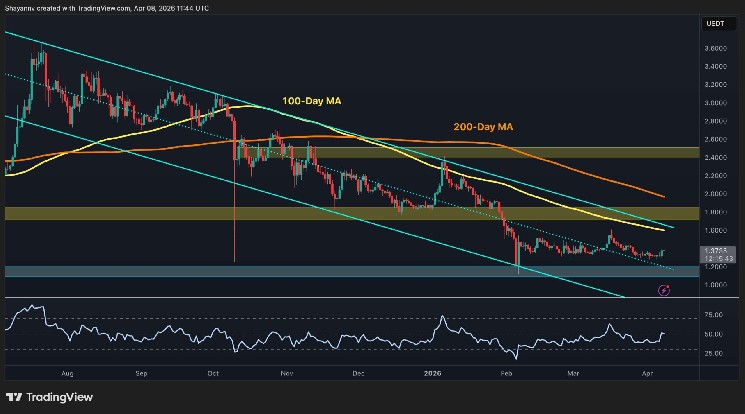
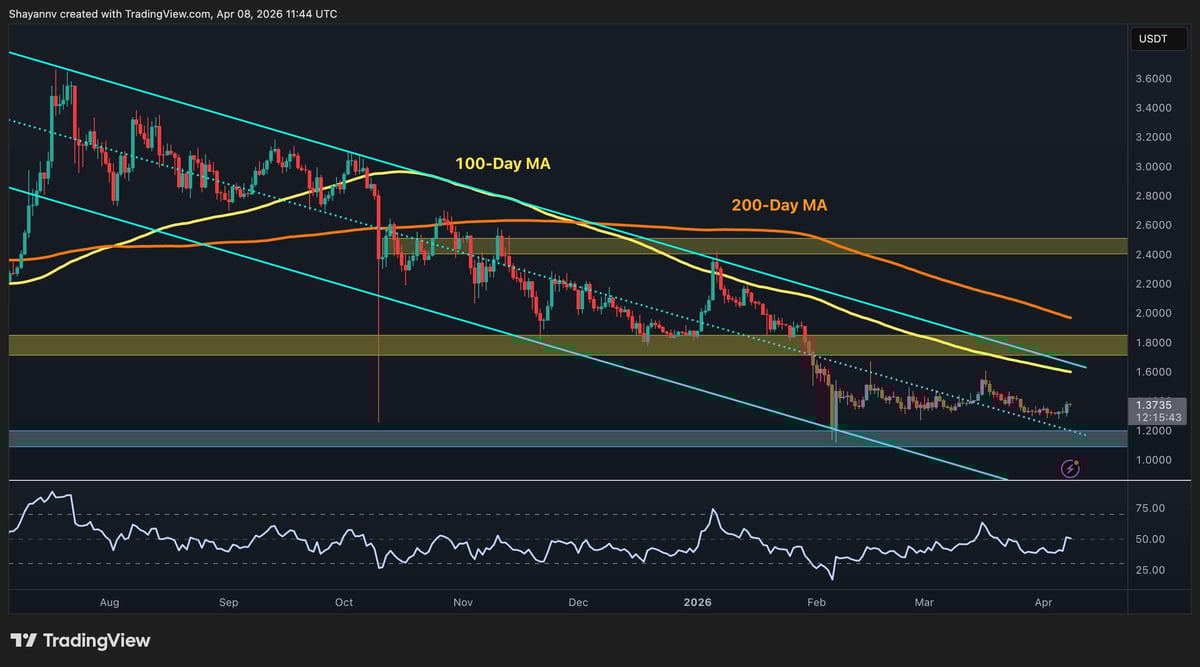
The $XRP/$USDT pair continues to grind inside the descending channel that has defined $XRP’s structure since the July 2025 peak. The current trading range is offering little encouragement for bulls. The 100-day MA (~$1.60) and 200-day MA (~$2.00) are both declining overhead and are converging around a tight supply zone at $1.80 that has capped every recovery attempt since February.
The mentioned $1.80 level remains the first critical threshold, and a sustained close above it would be the earliest sign of a structural shift. To the downside, the $1.20 support zone is the line in the sand. It held during February’s capitulation but might once again be approached as the price drifts lower.
The RSI has also recovered slightly toward 50 from deeply oversold levels in early February. Yet, the reading remains unconvincing for any directional bias. Therefore, a breakdown below $1.20 is still possible and would open the door to $1.00 and potentially lower.
The $BTC Pair
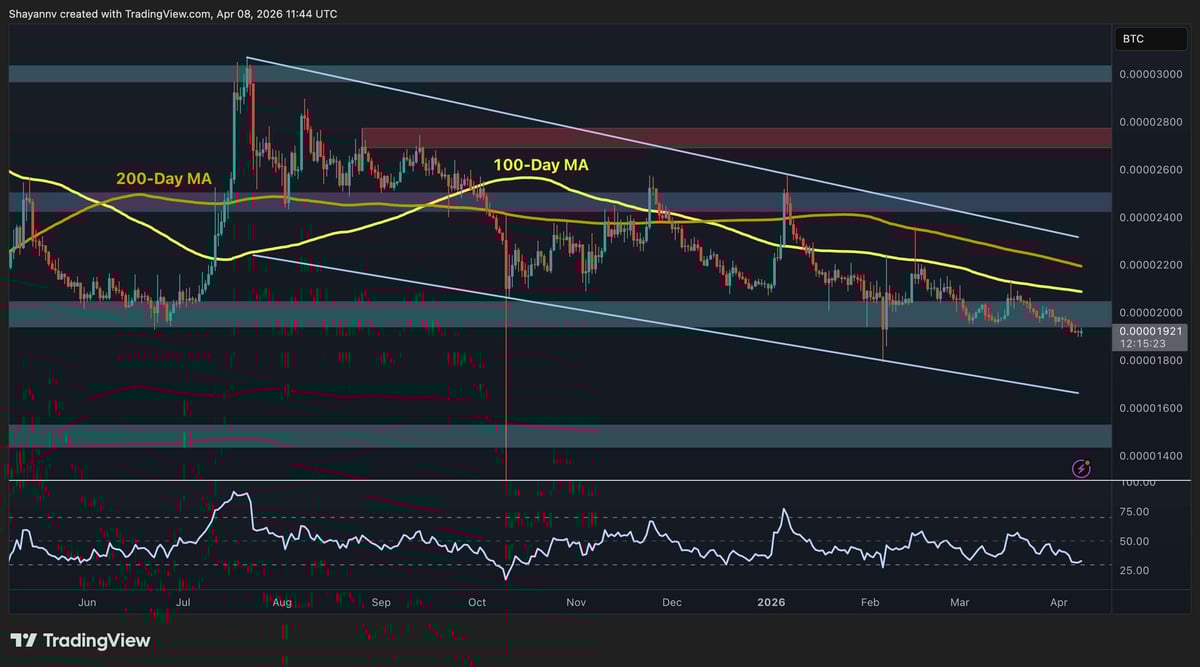
The $XRP/$BTC pair has deteriorated further and is now trading at approximately 1,921 sats, which is below the 2,000 sats support level that had held for much of the correction. The breakdown below that psychological threshold is a bearish development, confirming that $XRP continues to lose ground relative to Bitcoin even as the latter is still in an overall bearish trend.
Both the 100-day MA (~2,100 sats) and 200-day MA (~2,200 sats) remain above the current price and are still declining. The descending channel’s structure is also intact, and the RSI is hovering in the mid-30s, which is neutral at best, and no sign of bullish divergence forming yet.
The next support levels to watch sit at 1,600 sats (the lower boundary of the channel) and the 1,500 sats horizontal zone. On the upside, a reclaim of the 2,000 sats zone is the minimum requirement before any recovery narrative on this pair becomes credible.