

 5
5
With price action on the perpetual futures market hovering slightly above what looks to be an all-time low, Midnight is getting closer to a crucial point on the chart. Meanwhile, Shiba Inu took a huge hit, essentially losing most of its traction on the market. Dogecoin is acting like an asset on life support.
Good night for Midnight
It is obvious that the structure is bearish. The price is trading below all important moving averages, as $NIGHT continues to print lower highs and lower lows. Attempts to stabilize in the short term have consistently failed, with every small rally being sold into almost instantly. The absence of any significant trend reversal indicators implies that sellers are still in complete control.
This view is reinforced by volume behavior. After the initial peak during the launch period, trading activity has drastically decreased. The thin volume levels at the moment suggest low market participation and a lack of new capital. Strong reversals usually do not work well in this type of environment because sustained upward movements need steady inflows and fresh demand.
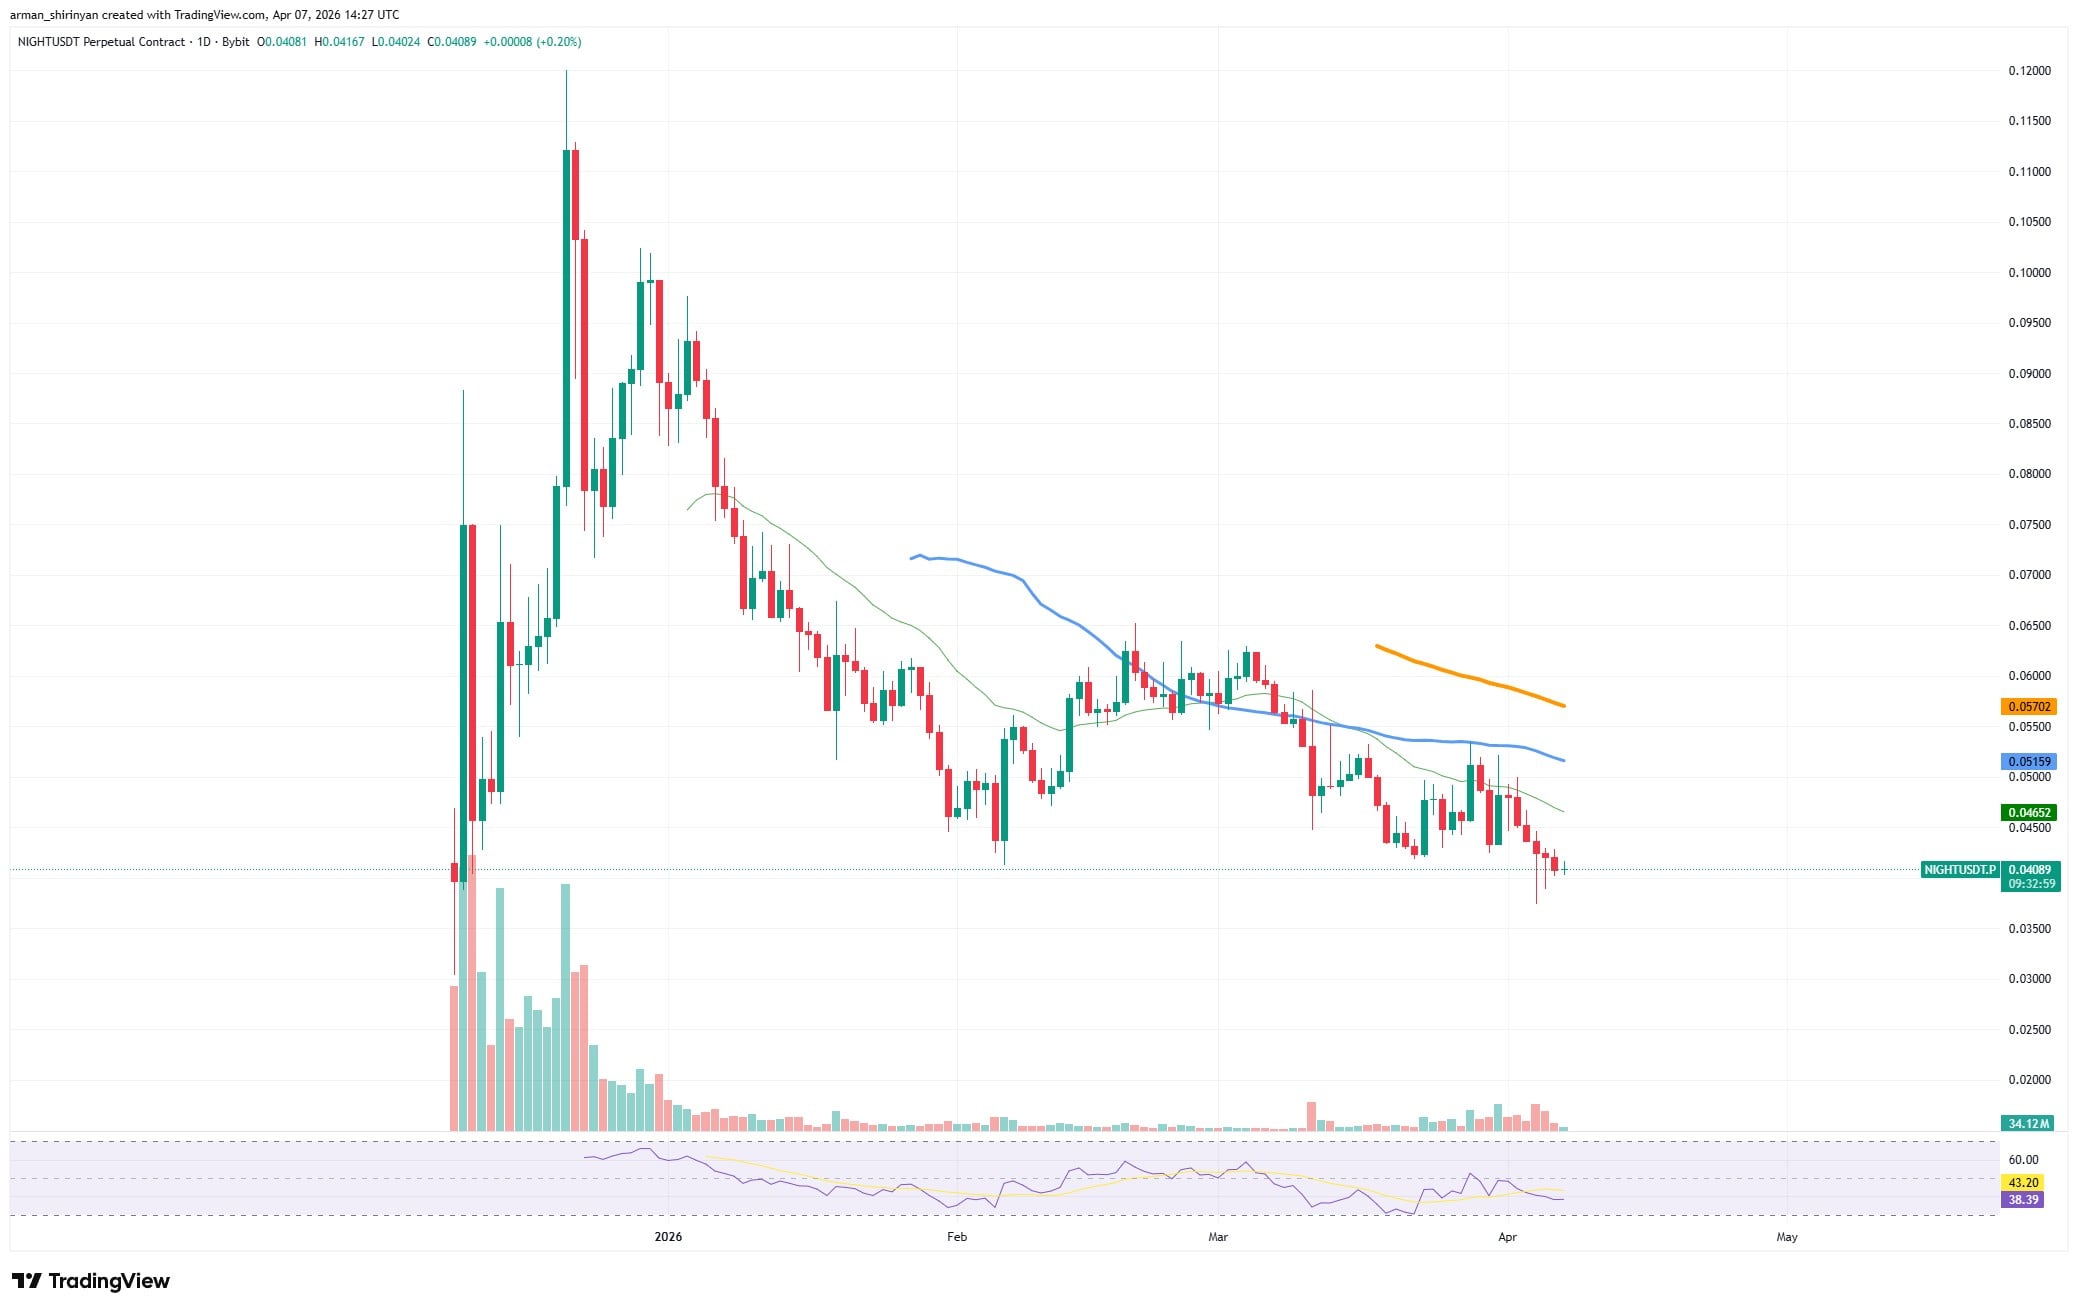
$NIGHT is also compressing in terms of volatility. A breakout is frequently preceded by tighter, less dynamic price movements, but direction is crucial. Such compression typically resolves to the downside or causes a persistent slow bleed, rather than an explosive recovery, in a larger downtrend with decreasing volume.
Although the data does not yet support a high-probability reversal scenario, the close proximity to all-time lows may draw speculative buyers searching for a bottom. When there is not a clear catalyst or narrative shift to spark new interest, assets at or near the all-time low may remain there for a long time.
The lack of demand and the ongoing bearish structure indicate that any recovery, if it occurs, is likely to be gradual rather than explosive, even though the downside may seem limited given closeness to historical lows.
Shiba Inu is vulnerable
Price action for Shiba Inu is still declining, falling below the crucial $0.000006 threshold, which served as short-term support in the past. The breakdown validates persistent bearish pressure and strengthens the longer-term downward trend.
$SHIB is still technically in a neat descending structure. All major moving averages, including the short-term and midterm EMAs, are sloping downward, and the price is trading below them. This alignment is a result of persistent selling pressure and a lack of bullish momentum.
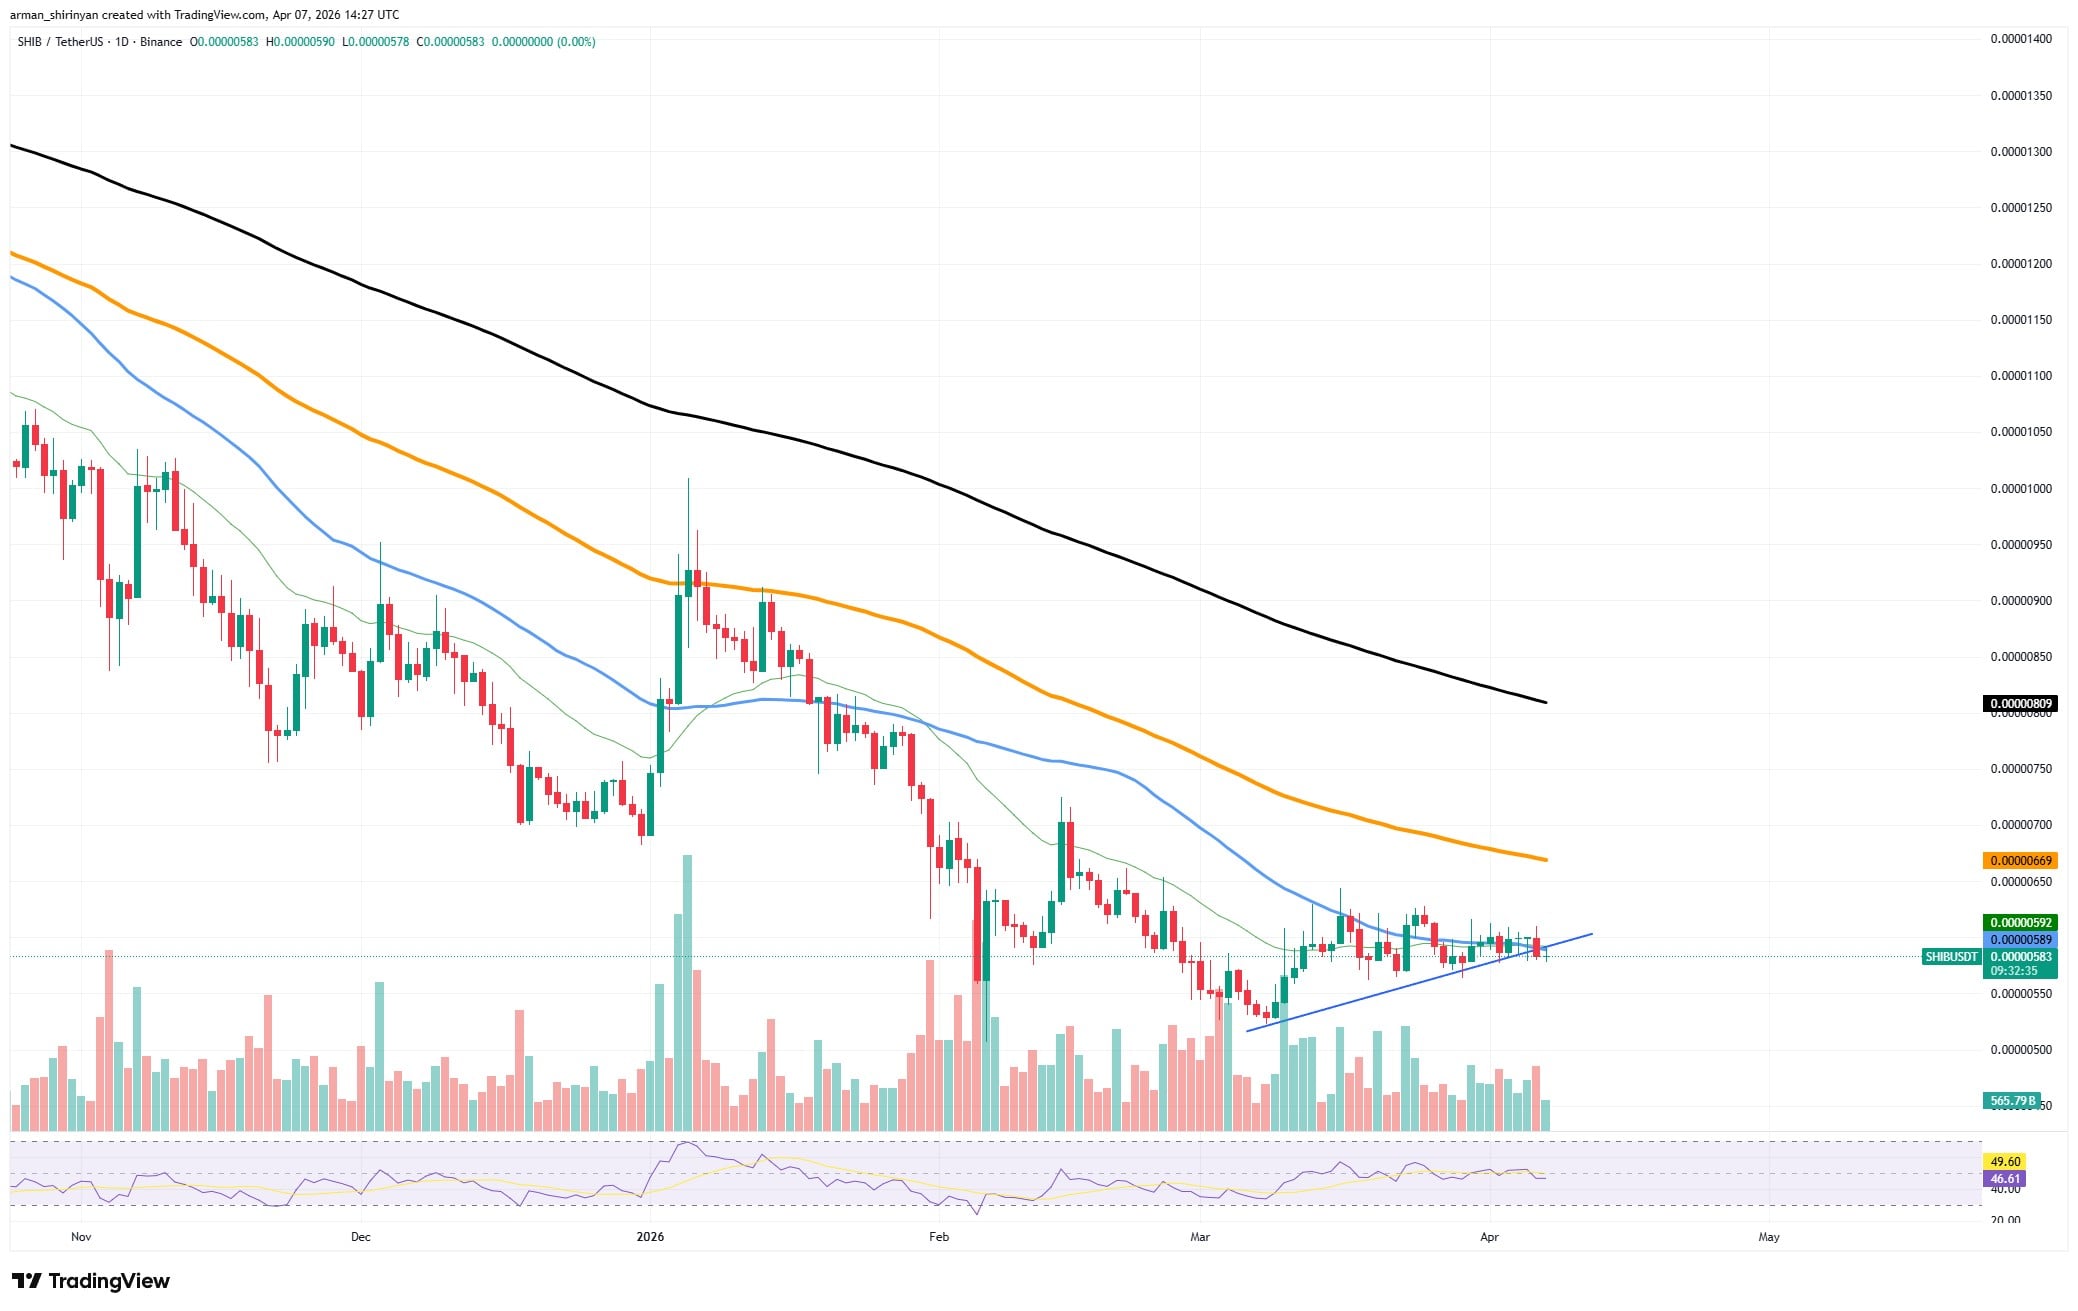
The structure appears more like a brief pause than a reversal, even though recent attempts at stabilization have created a weak ascending support line. Because it eliminates a structural and psychological support zone, the loss of the $0.000006 level is significant. When these levels fail, they frequently turn into resistance, which means that any rebound in that direction could result in fresh selling.
This makes it possible to shift toward lower liquidity zones, possibly aiming for past consolidation ranges that are lower than present levels. There is also little confidence in volume data. There are no obvious indications of accumulation, and trading activity has stayed comparatively quiet.
Momentum indicators are neutral to weak. RSI is in the lower-mid range and does not exhibit either bullish divergence or strong oversold conditions. This suggests that $SHIB can continue to fall without causing a significant technical recovery.
For investors, the situation is simple: $SHIB is under pressure, and until the contrary is demonstrated, the trend is still negative. Although brief bounces are possible, they are more likely to be remedial than the beginning of a long-term recovery. $SHIB may find it difficult to regain traction if the overall state of the market is still uncertain and capital keeps shifting away from speculative assets.
Dogecoin flattens out
Dogecoin's price action has flattened out following a protracted downtrend, indicating a clear indication of stagnation. Currently trading in the $0.09-$0.10 range, $DOGE has entered a low-volatility phase, where selling pressure and upward momentum seem to be muted. On the surface, this may appear stable, but the underlying structure is still weak.
Technically speaking, $DOGE is still trapped below the longer-term trend line, the 26 EMA and the 50 EMA, among other significant moving averages. The fact that these levels are sloping lower indicates that the overall trend is still negative.
The recent price movement creates a narrow consolidation range, but it is noteworthy that it comes after a prolonged decline, which is usually a continuation pattern rather than a reversal signal. Volume is consistent with this interpretation.
Compared to prior months, trading activity has drastically decreased, indicating a decrease in interest from both smaller and larger players. Any attempt at a breakout, especially to the upside, is likely to lack conviction and fail quickly in the absence of a significant increase in volume.
This flatline condition is also reflected by momentum indicators. The RSI is not clearly diverging or gaining strength; instead, it is hovering in neutral territory. This implies that the market is currently moving sideways with a slight bearish bias rather than getting ready for a reversal.