


 8
8
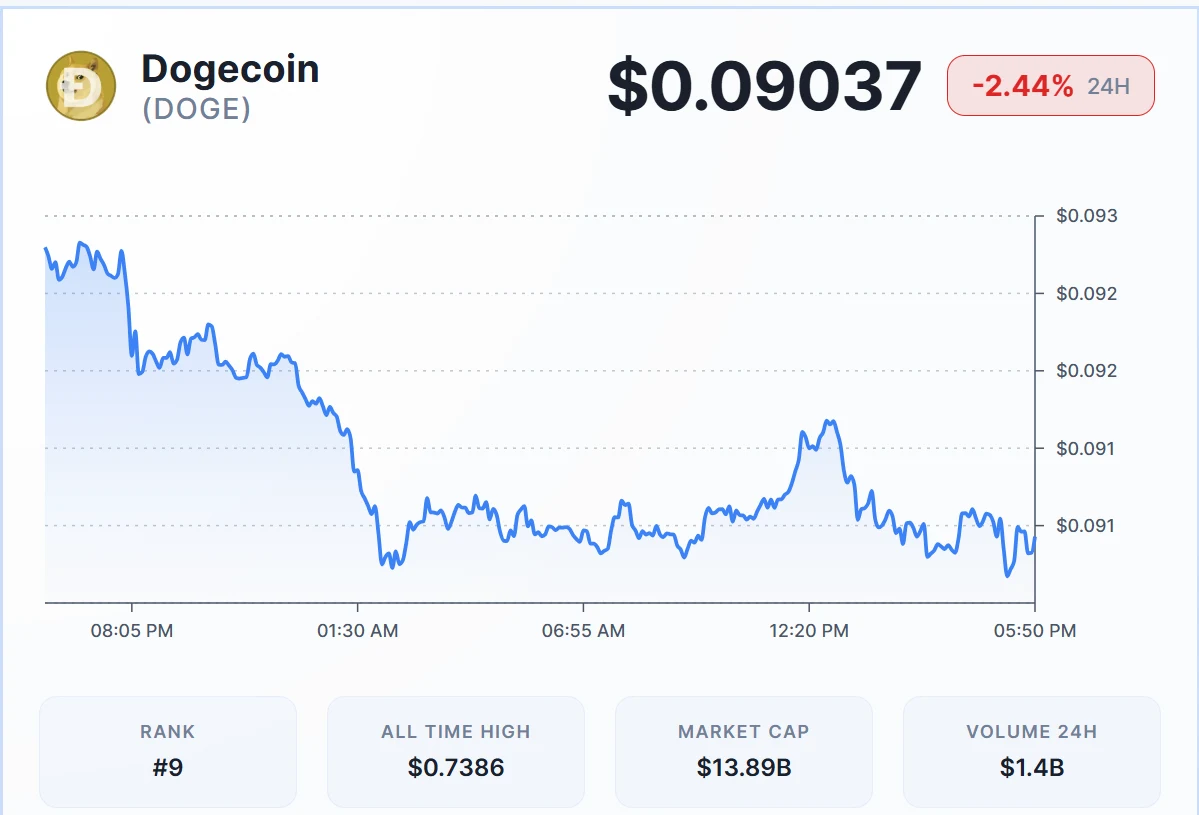
Dogecoin is trading near $0.0905 after falling from around $0.0925, confirming a short-term bearish structure. Price continues forming lower highs, showing sellers remain in control despite minor recovery attempts. A weak bounce failed to break resistance near $0.0915, reinforcing downward pressure. Support around $0.0900 is holding, but repeated tests increase the risk of a breakdown. Momentum remains limited, and without strong buying interest, price could extend losses toward lower support zones.
At the time of writing, Dogecoin is trading at around $0.09037, down by 2.44% in the past 24 hours.
Dogecoin Holds Near $0.091 as Key Breakout or Breakdown Looms
Dogecoin is trading around $0.091, holding just above a key demand zone. Price broke out of the falling wedge, a pattern that usually signals a bullish reversal. However, the move lacked follow-through, and sellers quickly pushed price back below resistance. This rejection indicates weak momentum and cautious market sentiment.
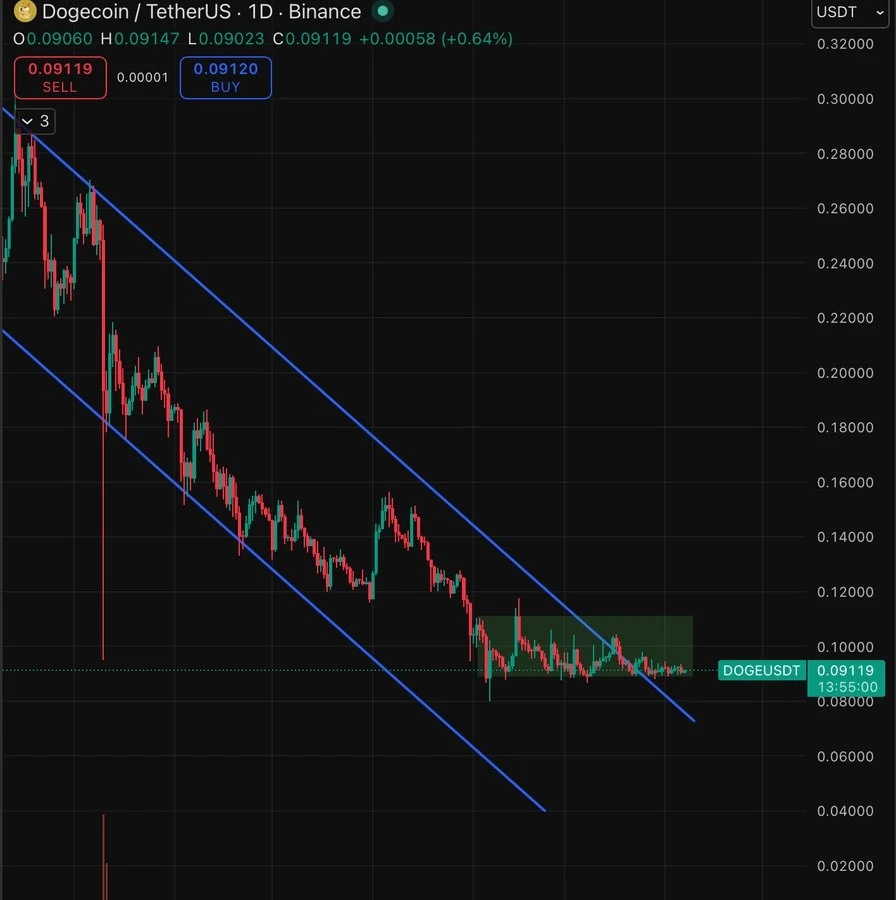
At $0.091, the price is compressing inside a tight consolidation range between $0.100 resistance and $0.088 support. This range reflects indecision, with neither buyers nor sellers in full control. Volume remains relatively low, which explains the lack of a strong directional move. A breakout from this zone will likely define the next trend.
If buyers step in strongly above $0.095–$0.100, price could regain bullish momentum and target higher levels. A sustained move above resistance would confirm strength and attract more participants. On the downside, losing $0.088 support could trigger another leg lower, continuing the broader bearish structure.
Dogecoin Price Stalls Near $0.090 as Momentum Weakens
Meanwhile, on the 1-day Dogecoin price chart shows consolidation after a prior downtrend. Price trades around $0.0903, holding above support near $0.0899 while facing resistance around $0.1000–$0.1234. Candles remain small, signaling reduced volatility and strong market indecision.
Price repeatedly reacts within this range, confirming it as a key accumulation zone. Buyers attempt to defend the lower boundary, while sellers cap upside moves near resistance, keeping the structure range-bound. A sustained move above $0.1000 could shift momentum, while a breakdown below $0.0899 may trigger further downside pressure.
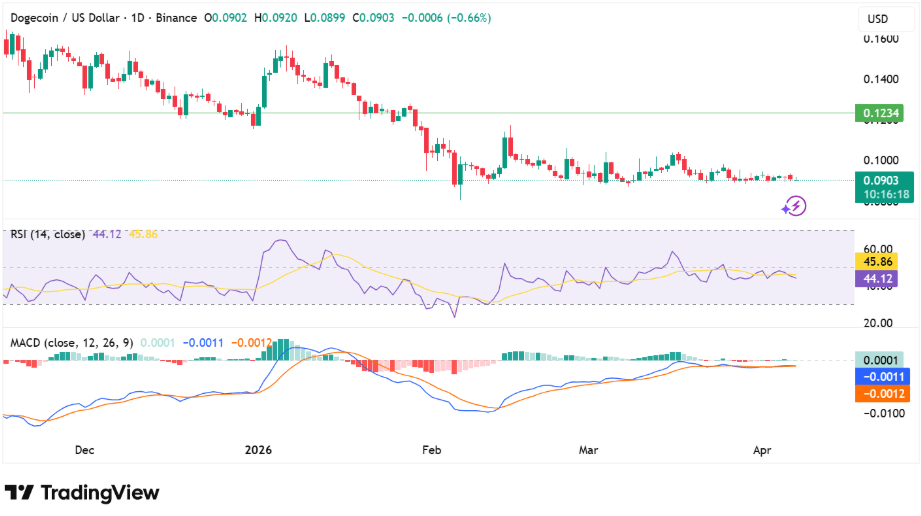
The RSI moves around 44–46, staying below the midpoint and showing mild bearish pressure without oversold conditions. This suggests buyers are not yet strong enough to regain control. MACD remains slightly negative, with both lines close together, signaling weak momentum and limited trend strength. The histogram prints small bars, indicating fading selling pressure and slowing bearish momentum.
