

 5
5
$ATOM, the native token of Cosmos, might be close to ending its prolonged bearish trend, one it has followed since 18 February 2025. In fact, thanks to a 5.25% price hike over the last 24 hours, $ATOM broke out of a narrow range, opening the door for a massive move on the charts.
$ATOM’s trading volume surged notably by 13.22% over the same period too. This suggested that market participants may be showing greater interest in $ATOM’s prevailing market trend.
Data further revealed that following its most recent gains $ATOM officially outperformed major cryptocurrencies like Bitcoin (BTC), Ethereum (ETH), XRP, and Solana (SOL) over the aforementioned period.
Is another potential 15% jump in the offing?
On the daily chart, the near-term bias for $ATOM appeared bullish at press time. Especially after it broke out of a falling wedge pattern with a large green engulfing candle.
However, the price still needs to close a daily candle above the pattern to confirm the breakout. Otherwise, it may turn out to be a fakeout instead.
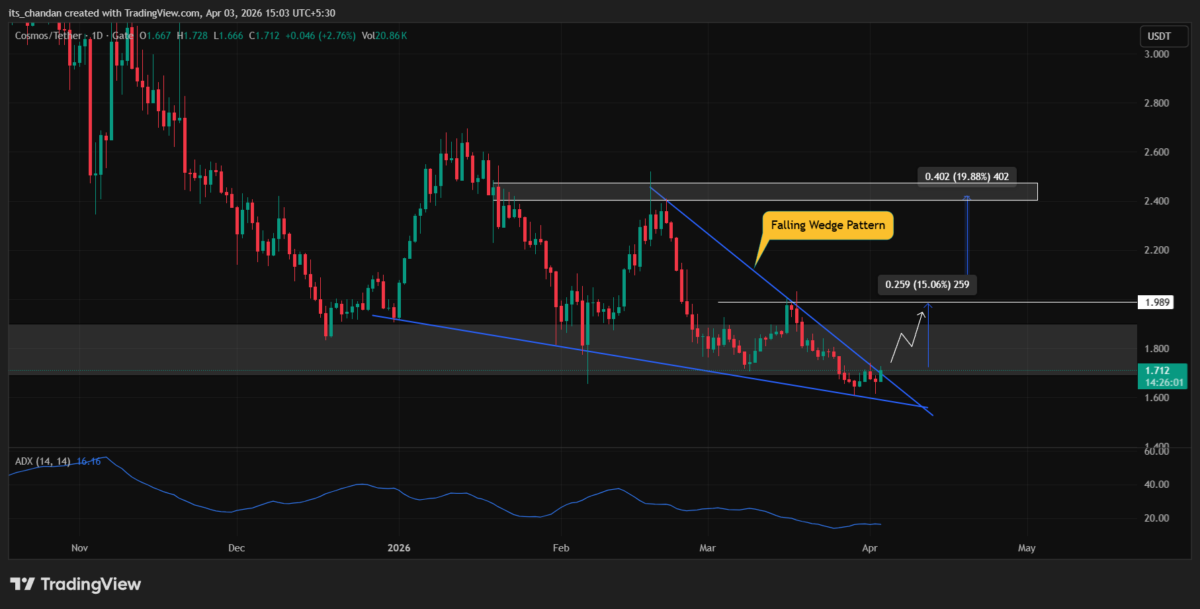
If $ATOM closes its daily candle above the $1.77-level, it could see a price jump of over 15% and may reach the next resistance at $1.98. A breakout above this resistance could trigger another 20% rally, potentially pushing the price towards the $2.40-level.
However, this bullish thesis could be invalidated if $ATOM’s price fails to close a daily candle above the $1.77-level.
At the time of writing, the technical indicator Average Directional Index (ADX) had fallen to 16.16, below the key threshold of 25. This hinted at weak momentum accompanying $ATOM’s price.
Investors and traders’ sentiment turns bullish!
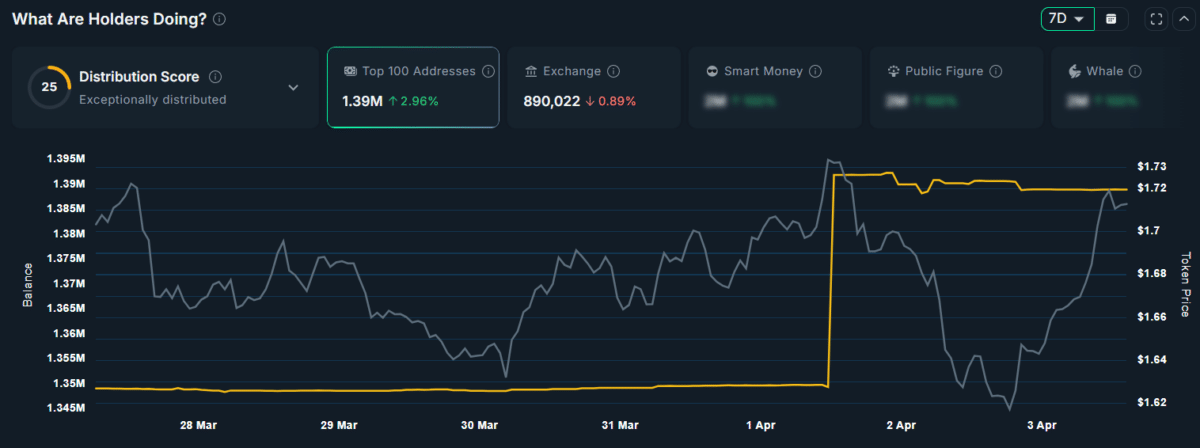
A look at analytics platform Nansen also revealed that the top 100 addresses may have already anticipated a move on $ATOM’s price charts. Especially since they increased their holdings by 2.96% over the past few weeks alone.
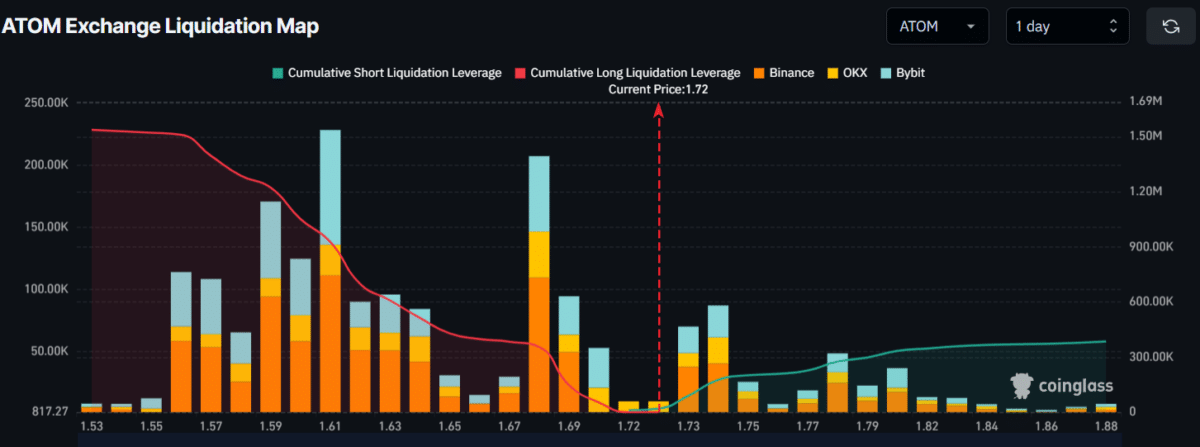
According to Coinglass, there has been significant interest among traders for $ATOM too, with many now expecting the price to continue rising.
As far as $ATOM’s exchange liquidation map is concerned, traders seemed to be highly active around the $1.61-level on the lower side (support) and $1.78 on the upper side (resistance). At these levels, they built $927.09K worth of long leveraged positions and $274.79K worth of short leveraged positions.
This suggested that bulls have been betting on further upside, while bears could just be exhausted.
Finally, $ATOM’s Open Interest (OI) increased by 3.57% to $124.82 million – A sign of rising trader participation and growing confidence in the altcoin’s momentum.
Final Summary
- $ATOM broke out of a bullish pattern, with the price action hinting at another 15% rally.
- Top 100 addresses increased their holdings, with many traders now betting on long positions.


