

 6
6
$SHIB trades at $0.0000059 on April 3, holding near the lower half of a descending channel that has been intact since September 2025. The burn rate collapsed 90.21% in the last 24 hours, dropping to just 167,246 $SHIB after the elevated activity earlier in the week, and the SAR at $0.0000627 continues to cap every recovery attempt on the daily chart.
Seven Months Inside A Descending Channel
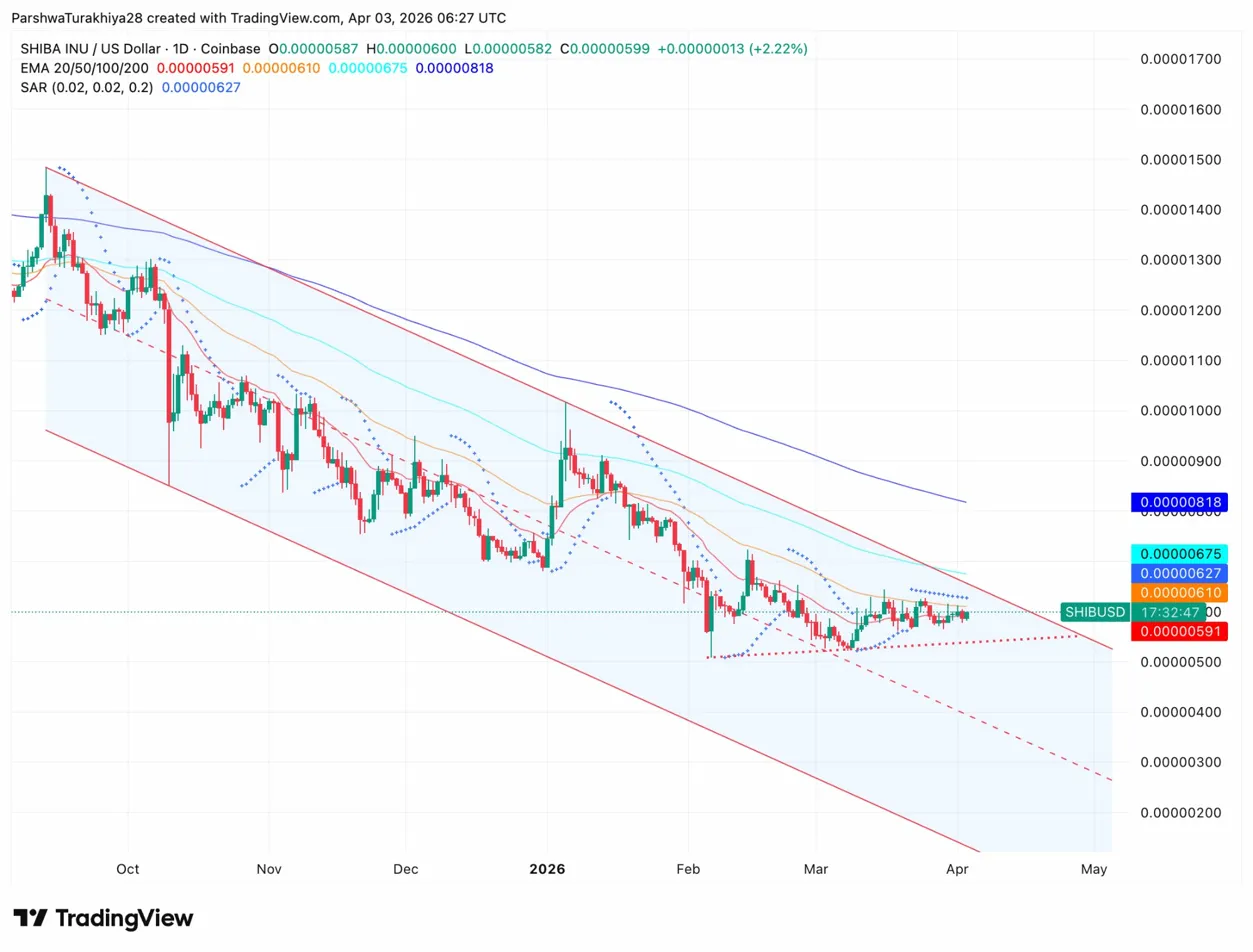
$SHIB Daily Price Action (Source: Coinbase)
The descending channel from the September peak near $0.000015 is still intact, with the upper boundary now near $0.0000075 and the lower boundary approaching $0.0000040 through April. $SHIB has been trading in the lower third of the channel since February, with the four EMAs declining overhead: the 20-day at $0.0000591, the 50-day at $0.0000610, the 100-day at $0.0000675, and the 200-day at $0.0000818.
Related: Cardano Price Prediction: ADA Tests $0.24 As Foundation Reports 45% Asset Drop
The SAR at $0.0000627 has been bearish since October without flipping. Every rally in the past six months has stalled before reaching it. A daily close above $0.0000627 would be the first SAR flip since October and the clearest signal that the channel’s grip is weakening. Until then, $0.0000591 at the 20-day EMA is the immediate hurdle, with the channel’s lower boundary near $0.0000400 as the downside floor through April.
Key Technical levels for $SHIB
- 20-day EMA resistance: $0.0000591
- SAR resistance: $0.0000627
- Channel upper boundary: $0.0000750
- Channel lower boundary: $0.0000400
- 200-day EMA: $0.0000818
Burn Rate Collapses 90% After Earlier Spike
The 24h burn rate dropped 90.21% to 167,246 $SHIB on April 3, a steep reversal from the elevated burns earlier this week. With 41.08% of the initial one quadrillion supply permanently removed since launch, the long-term supply reduction story remains intact, but the day-to-day burn rate is too inconsistent to use as a reliable price catalyst.
When burns are elevated, retail attention follows. When they collapse as sharply as today, that secondary tailwind disappears just as quickly.
$SHIB Derivatives: Shorts Taking More Pain
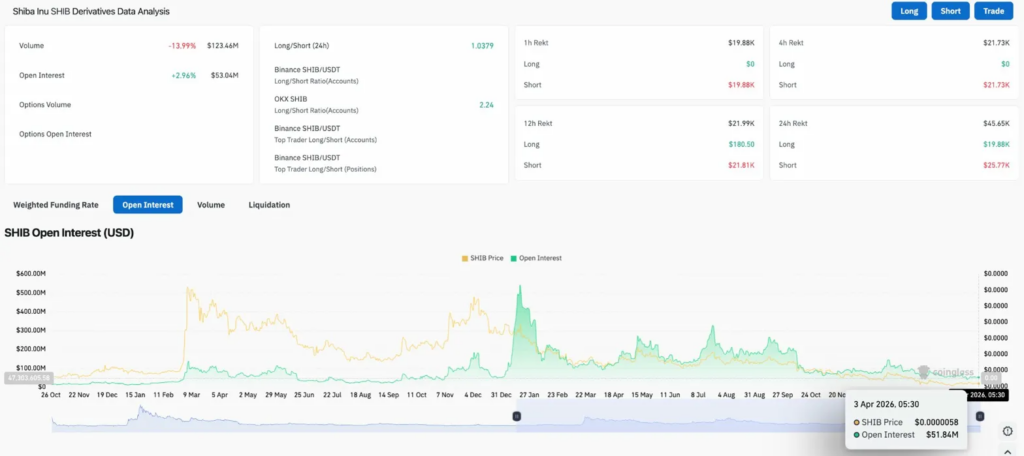
$SHIB Derivatives Data (Source: Coinglass)
Volume fell 13.99% to $123.46M while OI rose 2.96% to $53.04M. Declining volume with rising OI means new positions are being added quietly rather than through active trading, which typically reflects conviction rather than speculation. The long/short ratio sits at 1.0379, leaning slightly long, with OKX accounts at 2.24.
Over 24 hours, shorts absorbed $25.77K in liquidations against just $19.88K for longs, a reversal from the pattern of recent sessions where bulls were taking more pain. That short liquidation bias, modest as it is, aligns with the morning’s 2.22% price move. OI at $51.84M remains far below the $500M peak from January, leaving room for leverage to build if a catalyst arrives.
$SHIB Price Prediction: What Needs To Happen
- Upside: A daily close above the 20-day EMA at $0.0000591 would be the first meaningful EMA reclaim in weeks. From there the SAR at $0.0000627 is the level that decides April’s direction. Clear it and the channel midline near $0.0000750 opens as the month’s target. A burn rate recovery alongside the move would add retail momentum to a chart that needs a catalyst to break the channel.
- Downside: Fail to hold above $0.0000580 and the descending channel structure pulls price back toward the lower boundary near $0.0000400 through April. The burn rate dropping 90% removes one of the few positive narratives $SHIB has had this week, and with the channel six months old and unbroken, the default path without a catalyst remains lower.
