


 11
11
Historical data indicates that $XRP now sits in the same position it was in May 2022 during the bear market at that time.
This is in relation to the 200-week exponential moving average (EMA), a pivotal technical indicator that now acts as a dynamic resistance level. For context, $XRP recently lost the 200W EMA, putting it in the same position as it was during the downturn in May 2022. From here, the price could slip further to hit the current bear market’s bottom.
Key Points
- $XRP recorded another round of declines after it hit a peak of $1.6 on March 17, collapsing to the current price of $1.4.
- The latest downturn has now pushed the price below the 200-week exponential moving average.
- This recent price action now places $XRP at the same position it was in May 2022, right after it lost the support at the 200W EMA.
- From here, $XRP could suffer steeper declines to reach a bottom before the price can start seeing rebound efforts.
- Data surrounding the Gaussian Channel suggests the bottom could come in at the $0.7 to $0.8 price range.
The Latest Round of Declines
This comes from an analysis shared by market watcher Chart Nerd, as $XRP struggles to maintain the gains it picked up during the rally earlier this month. For context, after collapsing to a local floor of $1.27 following the escalation of the Israel-Iran conflict on Feb. 28, $XRP and the broader crypto market recovered.
The $XRP price first rebounded to a high of $1.47 on March 4 before pulling back to $1.32 after four days. Shortly after this, another recovery effort ensued, allowing $XRP to rally to the $1.6 peak on March 17. However, the resistance at this mark halted the uptrend, leading to declines that have persisted until now.
$XRP Loses the 200W EMA
As a result of these declines, $XRP recently crashed below the pivotal 200-week EMA ($1.40). This marked the first time $XRP would trade below this technical level since its November 2024 upsurge. $XRP dropped and closed below the moving average last week, and with its price currently sitting at $1.35, the asset remains below the key level.
Now, the 200W EMA has flipped from support to resistance that could stifle $XRP’s upward potential during times of a rebound. Interestingly, data from Chart Nerd’s chart indicates that, with the recent drop below this moving average, $XRP now trades in the same position it was in May 2022 during the bear market at the time.
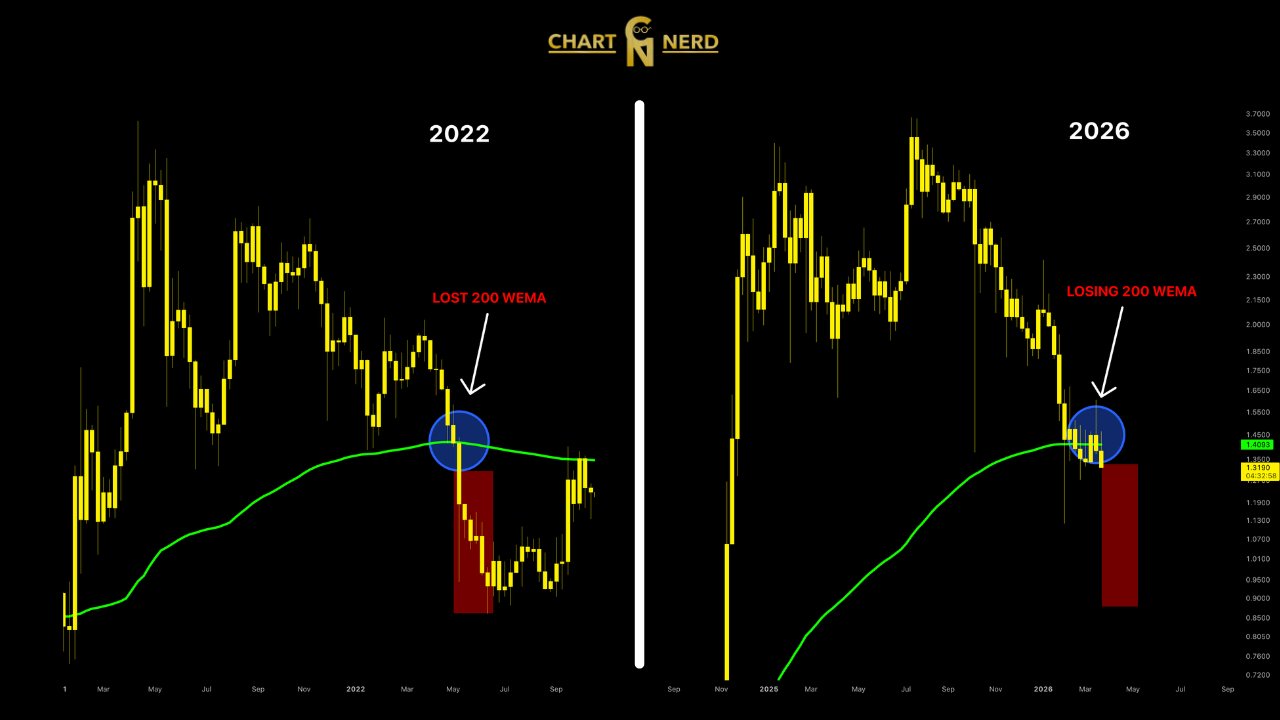
The analyst had, in a previous commentary, argued that $XRP has officially entered a full-blown bear market. His recent chart suggests that $XRP could see steeper declines from here after losing the 200W EMA. When it lost this level in May 2022, what followed was an additional 50.8% crash from $0.57 to $0.28. This low eventually marked the bottom for that bear market.
Chart Nerd believes a similar pattern could play out this time. He has already mapped out a possible downward trend for $XRP, potentially reaching $0.8 to $0.9. This aligns partially with the $0.7 to $0.8 range identified by the market watcher in a previous commentary. According to him, this level aligns with the upper band of the 2-week Gaussian Channel, and could mark $XRP’s bottom.