

 11
11
An emerging Cardano harmonic pattern suggests the coming bull season could be much bigger than the previous two cycles.
The analysis follows a period of price consolidation for Cardano ($ADA), which has brought it down to more than 90% of its 2021 all-time high of $3.10. With the broader market remaining cautious and bears still in charge, a recent analysis has identified an optimistic chart development on a higher timeframe.
Key Points
- A recent Cardano analysis highlights a sequence of repeating harmonic patterns that continues to increase in scale over time.
- The earliest pattern, a “shark,” was small, with $ADA growing 243% from $0.236 in September 2023 to $0.810 in March 2024.
- An even larger formation (Cypher) followed, and the pattern saw the coin rally 376%.
- The most recent structure (butterfly) is significantly bigger, indicating the possibility of a more substantial move if the pattern continues to play out.
Cardano Harmonic Pattern
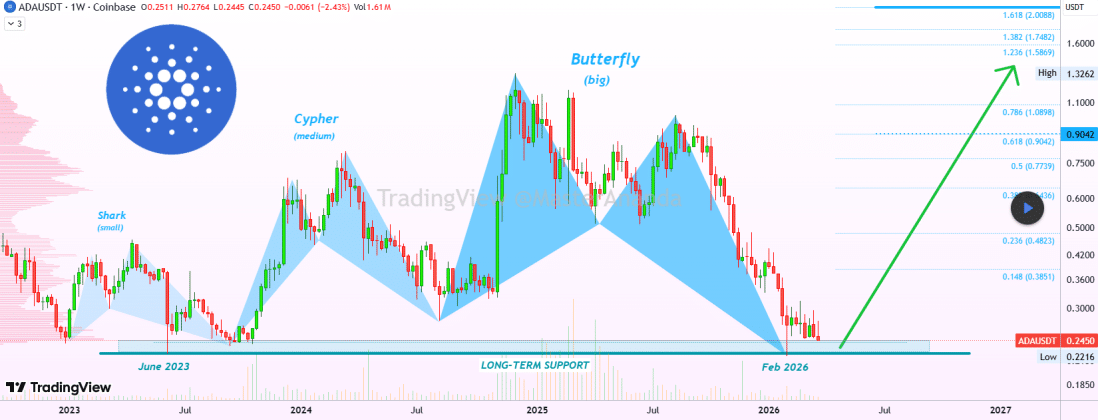
A recent analysis of the $ADA/USDT weekly chart by MasterAnanda highlights a sequence of repeating harmonic patterns that appear to increase in scale over time. Each formation seems to correspond with a stronger upward phase than the one before it, suggesting a structured rhythm in Cardano’s price behavior.
Notably, the earliest pattern on the chart is relatively small, with the analyst calling it a “shark.” $ADA moved from a low of $0.236 in September 2023 to $0.810 in March 2024, representing a 243% increase. An even larger formation (Cypher) followed, which precedes a more pronounced recovery. The pattern saw the coin rally 376% from $0.277 in August 2024 to $1.32 in December 2024.
Meanwhile, the most recent structure (butterfly) is significantly bigger, indicating the possibility of a more substantial move if the pattern continues to play out in a similar way.
Expanding $ADA Patterns
The progression from smaller to larger harmonic formations suggests a gradual growth in momentum across cycles. Each phase reflects a transition from a corrective period into a recovery phase, with the magnitude of the move increasing alongside the size of the pattern.
This aligns with the broader behavior often seen in the crypto market, where extended periods of weakness precede stronger recoveries. The chart shows that Cardano entered a downward phase after a high of $1.018 in August 2025 and is trading near a key support area.
As the bearish $ADA trend persists, the harmonic structure suggests the market may be transitioning out of that phase. Recent price action around the long-term support further adds context.
Cardano Long-Term Support and Double-Bottom Formation
MasterAnanda highlighted another notable feature on the chart: the long-term support zone. This level lies between $0.220 and $0.245, with history showing it has been a major area where Cardano has recorded turning points. $ADA reached this support in June 2023, dropping to a low of $0.220 before rebounding to far higher prices.
Additionally, Cardano recently tested this long-term support in February, dropping to $0.220. The analysis suggests this is a long-term double-bottom formation, indicating the price may have bottomed.
Notably, the earlier interaction with this support zone led to a prolonged recovery phase. As such, the recent retest may suggest that a similar price trajectory could unfold again.
Supporting this narrative is the prolonged period of bearish price trends. The market watcher noted that Cardano entered the bearish phase in December 2024. Usually, the market turns bullish after activating support and an elongated bearish period.