


 8
8
Shiba Inu is displaying early signs of a behavioral change, according to recent on-chain data. Key metrics suggest that selling pressure is easing and accumulation activity may be picking up. The signals remain preliminary, but they mark a notable departure from the sustained bearish trend that has defined $SHIB's recent market activity.
Over the past 24 hours, approximately 30 billion $SHIB tokens have exited centralized exchanges. This type of netflow reversal, where assets move from trading platforms into private wallets is widely interpreted as an accumulation signal. Traders who transfer tokens off exchanges typically intend to hold rather than sell in the near term. The shift reduces the readily available supply on exchanges and lowers the immediate sell pressure.
It is important to note that exchange reserves for $SHIB remain elevated in absolute terms. The short-term shift is notable, but a single 24-hour window of outflows does not constitute a structural trend. Sustained and consistent outflows over a longer period would carry far greater significance.
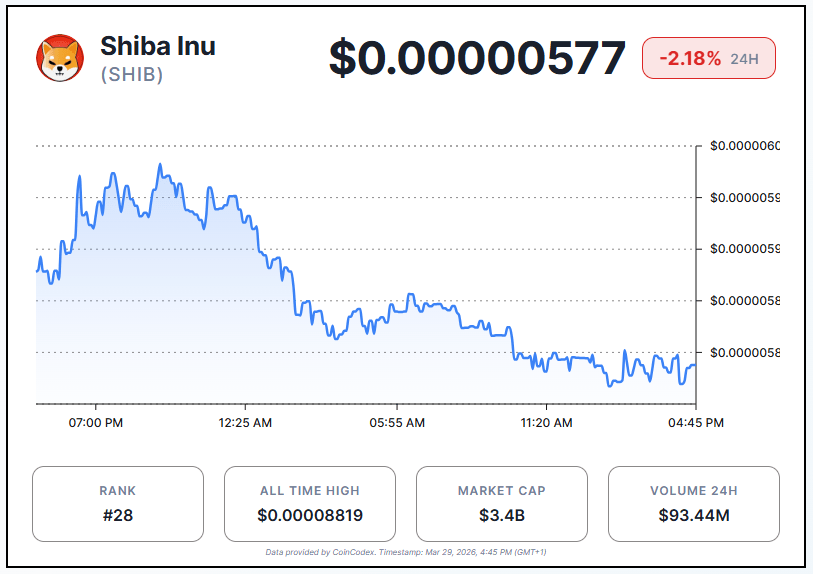
At the time of writing, Shiba Inu trades at around $0.00000577, down 2.18% in the last 24 hours.
Active Addresses Hint at Residual Demand
Alongside the outflow data, analysts have flagged a modest uptick in active receiving addresses. This metric tracks the number of unique wallets accepting $SHIB transfers, and an increase suggests that demand is still present even as broader market sentiment turns risk-off.
The combination of declining exchange supply and growing wallet activity creates a marginally constructive backdrop. It does not confirm a bullish breakout. It does indicate that retail and possibly institutional participants have not abandoned the asset entirely during the current downturn. Demand, while modest, remains visible in the data.
This nuance matters. Accumulation at lower price levels is common in bear markets and does not automatically precede price recovery. The quality and consistency of that demand, measured over days and weeks, not hours, will determine whether the current signals hold any lasting significance.
Price Structure Compresses, But Resistance Remains Overhead
On the price chart, $SHIB continues to trade below its 50-day and 100-day exponential moving averages (EMAs). Both indicators are trending downward and represent dynamic resistance. Any upward price movement is likely to encounter selling pressure from these levels before any meaningful breakout can occur.
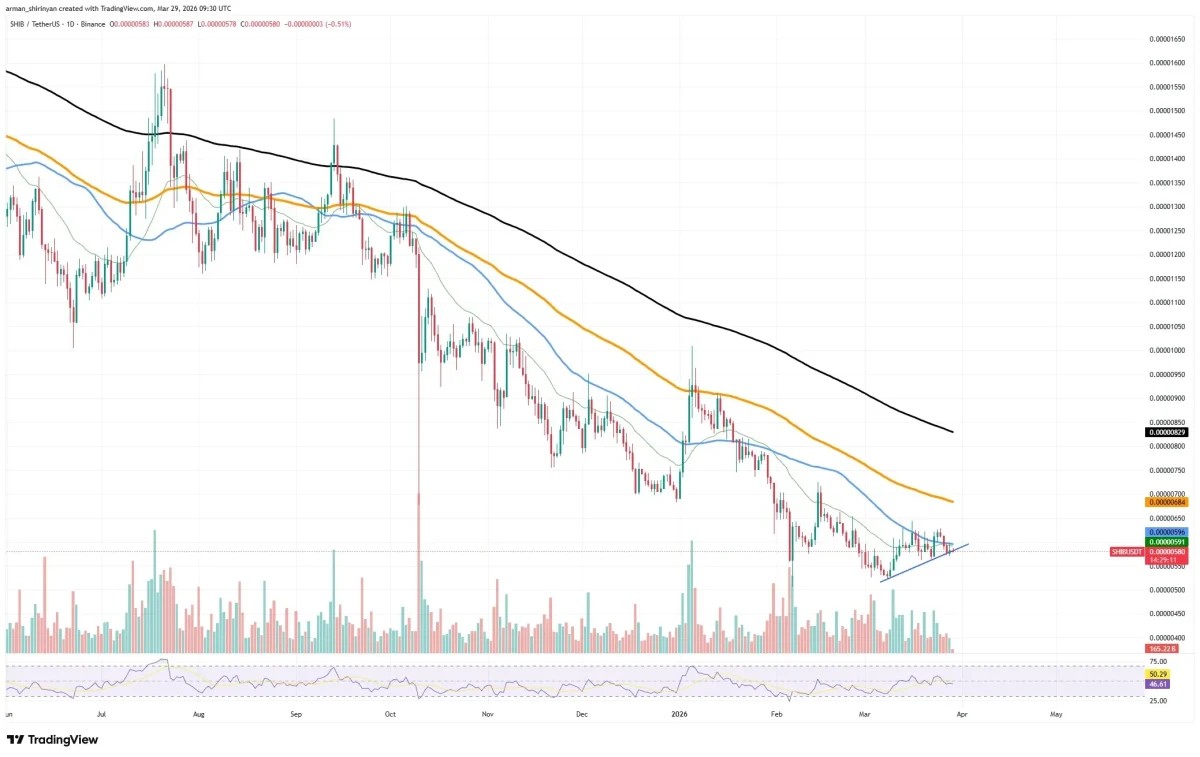
That said, the chart structure has begun to show early compression. Since its most recent local bottom, $SHIB has printed higher lows and is developing a tentative ascending support line. This is the first constructive technical pattern to emerge after a prolonged decline. Higher lows reduce the rate of downside deterioration, but they do not constitute a confirmed trend reversal.
For a genuine bullish shift in market structure, $SHIB would need to clear the overhead EMAs convincingly and print higher highs. Until that occurs, the asset remains in a technically bearish position despite the improving short-term formation.
Short-term moving averages have acted as dynamic resistance for several months. $SHIB is attempting to reclaim these levels. Whether it succeeds will depend on the volume profile accompanying any push higher. Low-volume recovery attempts in downtrends typically fail at resistance.
