

 4
4
Key takeaways
- In 2026, Polkadot might reach a maximum price value of $2.01 and an average value of $1.73.
- In 2029, the $DOT price is expected to range from a maximum of $6.32 to a minimum of $5.16.
- The price of Polkadot is predicted to reach a maximum value of $18.44 in 2032.
Polkadot ($DOT) is a next-generation blockchain network designed to connect and secure multiple blockchains, enabling them to share data and operate together seamlessly. Created by Ethereum co-founder Gavin Wood, Polkadot aims to solve key issues such as scalability, interoperability, and security through its unique multi-chain architecture.
The network’s central relay chain coordinates specialized blockchains known as parachains, allowing transactions to be processed in parallel for greater efficiency. $DOT, the native token, is used for network governance, staking to secure the ecosystem, and bonding to add new parachains, making it a core component of Polkadot’s growing Web3 infrastructure.
Will $DOT reach new heights soon? Let’s get into the Polkadot price prediction for 2026-2032.
Overview
| Cryptocurrency | Polkadot |
| Token | $DOT |
| Price | $1.28 |
| Market Cap | $2.151B |
| Trading Volume | $290.39M |
| Circulating Supply | 1.676B $DOT |
| All-time High | $55.00 Nov 4, 2021 |
| All-time Low | $1.15 Feb 06, 2026 |
| 24-hour High | $1.34 |
| 24-hour Low | $1.27 |
Polkadot price prediction: Technical analysis
| Volatility | 4.53% (Medium) |
| 50-Day SMA | $1.47 |
| 14-Day RSI | 38.11 (Neutral) |
| Sentiment | Bearish |
| Fear & Greed Index | 13 (Extreme Fear) |
| Green Days | 10/30 (33%) |
| 200-Day SMA | $2.44 |
Polkadot price analysis
- Polkadot remains in a strong downtrend across both daily and 4-hour timeframes.
- OP is consolidating near $1.28, with RSI approaching oversold territory.
- Unless price reclaims $1.35, downside continuation toward $1.25 and $1.20 remains a likely outcome.
Polkadot daily price chart
On the daily timeframe for March 27, Polkadot remains in a clear downtrend, trading around $1.28 and firmly below the 20-day moving average at $1.46. The structure has shifted decisively bearish since mid-March, forming consistent lower highs and lower lows.
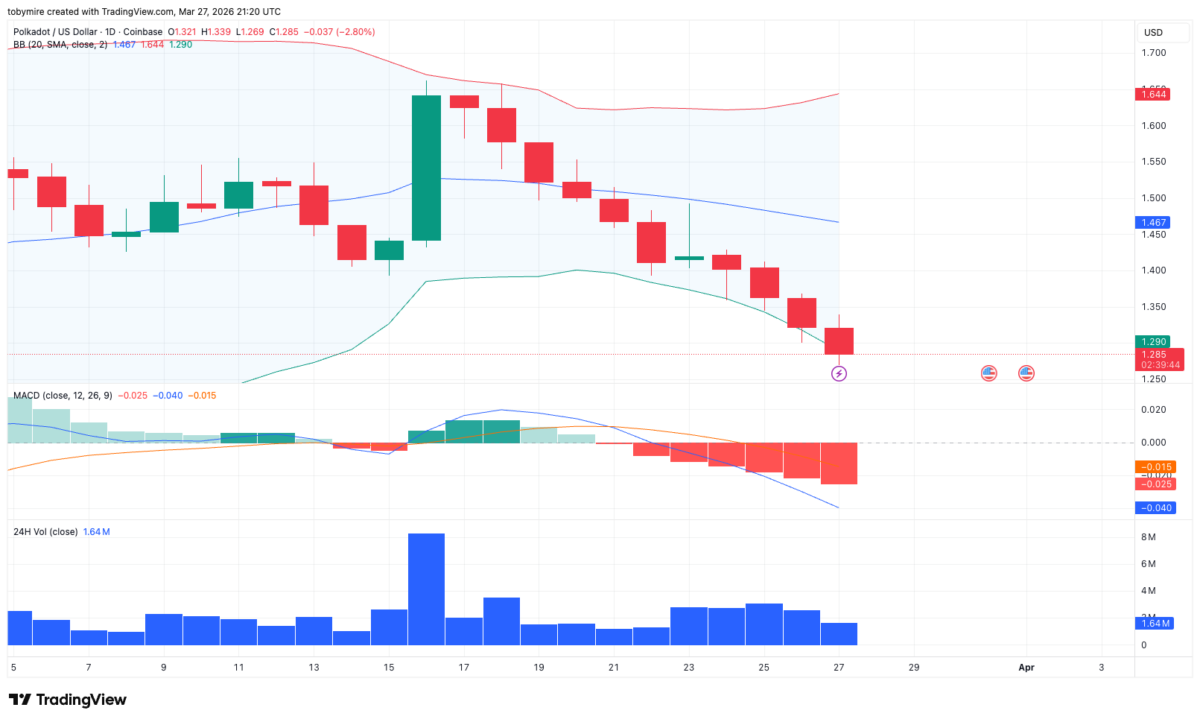
The strong bullish move seen around March 16 has been completely retraced, reinforcing the lack of sustained buying interest. $DOT is now pressing along the lower Bollinger Band, which typically signals continuation rather than exhaustion. Momentum indicators confirm this view, with the MACD showing a bearish crossover and expanding negative histogram, suggesting that downside pressure is still building rather than fading.
Polkadot 4-hour price chart
On the 4-hour timeframe, there are early signs that the aggressive selloff is slowing, but not reversing. OP has started to consolidate in a tight range between $1.27 and $1.29 following a sharp drop. The Alligator indicator remains fully aligned to the downside, reflecting a strong underlying bearish trend.
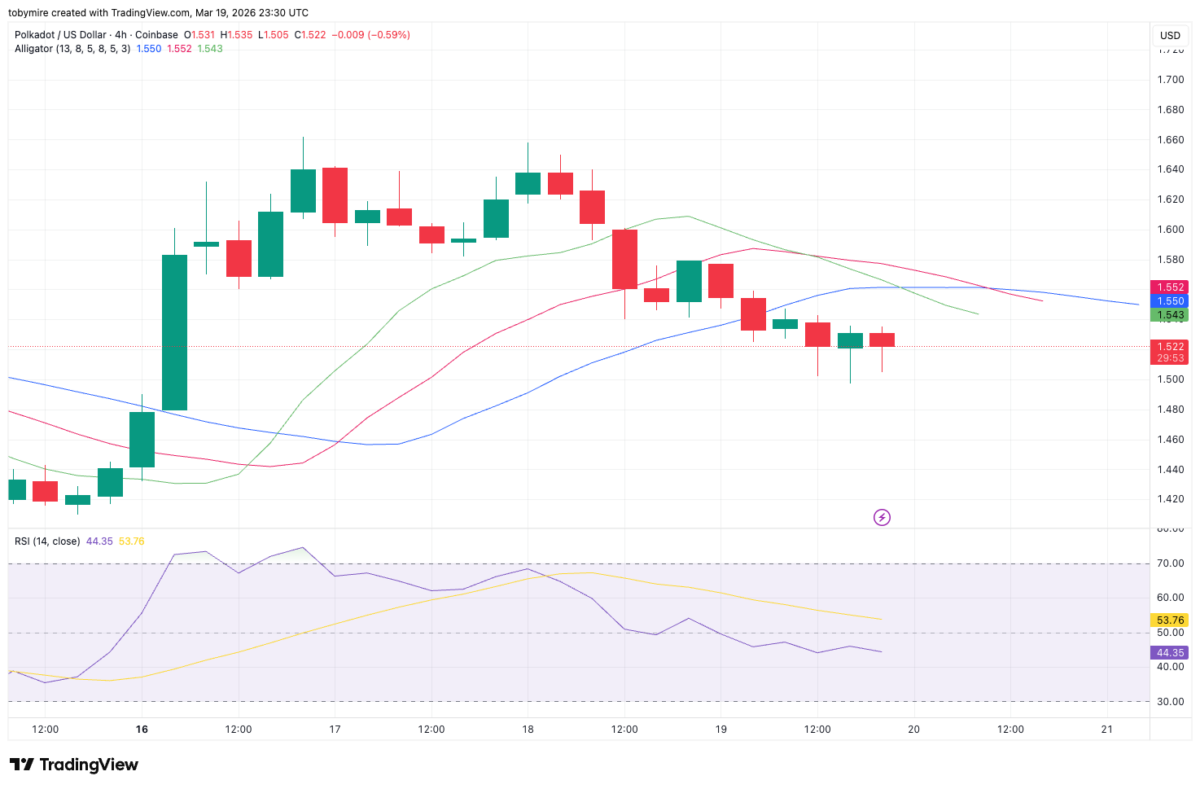
At the same time, RSI is hovering around 30, indicating that the asset is approaching oversold conditions, though not yet at levels that typically trigger strong reversals. The recent candles are smaller and less directional, pointing more toward temporary balance or seller exhaustion rather than a confirmed shift in trend.
Polkadot technical indicators: Levels and action
Daily simple moving average (SMA)
| Period | Value | Action |
|---|---|---|
| SMA 3 | $1.65 | SELL |
| SMA 5 | $1.54 | SELL |
| SMA 10 | $1.47 | SELL |
| SMA 21 | $1.48 | SELL |
| SMA 50 | $1.47 | SELL |
| SMA 100 | $1.71 | SELL |
| SMA 200 | $2.44 | SELL |
Daily exponential moving average (EMA)
| Period | Value | Action |
|---|---|---|
| EMA 3 | $1.48 | SELL |
| EMA 5 | $1.52 | SELL |
| EMA 10 | $1.64 | SELL |
| EMA 21 | $1.77 | SELL |
| EMA 50 | $2.01 | SELL |
| EMA 100 | $2.43 | SELL |
| EMA 200 | $3.02 | SELL |
What can you expect next for Polkadot ($DOT)?
The overall bias remains bearish across both timeframes. Any short-term bounce toward the $1.32 to $1.35 region is likely to face resistance and may be sold into unless there is a clear shift in structure.
A breakdown below $1.25 would likely open the path toward $1.20. For bulls to regain control, price would need to reclaim $1.35 convincingly and then push above $1.46, which currently acts as a key trend level. Until that happens, rallies are more likely to be corrective within a broader downtrend.
Is Polkadot a good investment?
Polkadot ($DOT) shows cautious short-term price behavior, trading in a tight range between $1.25 and $1.30. For investors, this range-bound movement suggests monitoring price action carefully before committing, as the market is currently indecisive.
Long-term potential depends on Polkadot’s continued network development, adoption, and overall crypto market conditions. Traders seeking short-term gains should wait for a clear breakout above resistance or breakdown below support, while long-term investors may consider $DOT’s technology and ecosystem growth as part of their evaluation.
Why is Polkadot Down today?
Polkadot ($DOT) is down today, trading at $1.27, largely due to cautious market sentiment and short-term profit-taking. Traders are closely watching the $1.25 support level, and minor selling pressure has contributed to the 1.77% decline.
Broader crypto market volatility and consolidation in major tokens also weigh on $DOT’s price. Investors remain hesitant as the market navigates a tight range between $1.25 and $1.30, reflecting uncertainty before a potential breakout or further dip.
Will Polkadot reach $10?
Yes, according to long-term predictions, Polkadot is projected to reach up to $10 by 2031.
Will Polkadot reach $15?
Yes, according to the long-term predictions, Polkadot is projected to reach up to $15 by 2032.
Will Polkadot reach $100?
Reaching $100 for Polkadot ($DOT) is highly ambitious and unlikely in the near term.
Does Polkadot have a promising long-term future?
Based on Polkadot’s ongoing buying demand and positive community support, the $DOT price is set to make new highs in the coming years. However, you are advised to do your research before investing in the volatile market, especially considering future performance.
Recent news/opinion on Polkadot
- NEW: The SEC identifies Polkadot ($DOT) as a digital commodity, not a security.
The SEC issued, with related guidance from the CFTC, its interpretation on certain crypto assets.
— Polkadot (@Polkadot) March 18, 2026
In the release, the SEC identifies Polkadot ($DOT) as a digital commodity, not a security.
$DOT is listed alongside 15 other digital commodities, including BTC, ETH, and others. pic.twitter.com/o4MxVIjWJ5
Polkadot price prediction March 2026
For March, Polkadot is expected to reach a low of $1.25, with an average around $1.46. On the higher end, $DOT could reach up to $1.68.
| Month | Potential Low | Potential Average | Potential High |
| March | $1.25 | $1.46 | $1.68 |
Polkadot price prediction 2026
The $DOT price prediction for 2026 anticipates a minimum value of $1.15 and a maximum value of $2.01. The token price and the coin’s average value could be around $1.73.
| Polkadot Price Prediction | Potential Low | Potential Average | Potential High |
| 2026 | $1.15 | $1.73 | $2.01 |
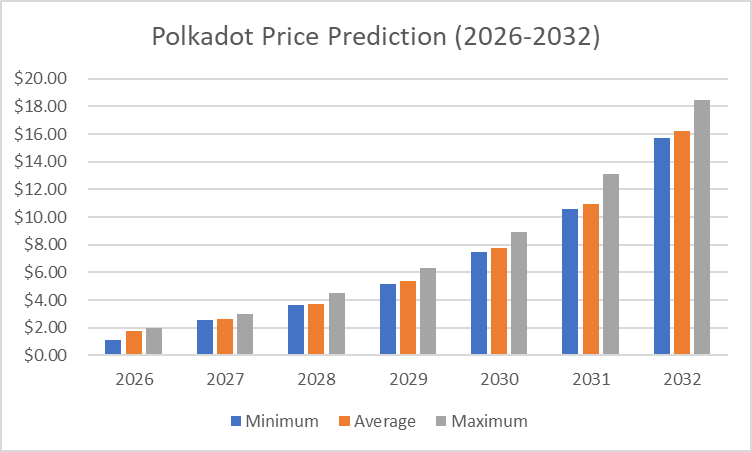
Polkadot Price Predictions 2027-2032
| Year | Minimum Price | Average Price | Maximum Price |
| 2027 | $2.56 | $2.63 | $3.01 |
| 2028 | $3.65 | $3.75 | $4.51 |
| 2029 | $5.16 | $5.35 | $6.32 |
| 2030 | $7.50 | $7.77 | $8.93 |
| 2031 | $10.57 | $10.96 | $13.13 |
| 2032 | $15.69 | $16.24 | $18.44 |
Polkadot price prediction 2027
According to the Polkadot prediction for 2027, $DOT could reach a maximum price of $3.01, with the lowest price expected to be $2.56, and an average forecast price of $2.63.
Polkadot price prediction 2028
The price of Polkadot is predicted to reach a minimum value of $3.65 in 2028. Per expert analysis, $DOT tokens could reach a maximum value of $4.51 and an average trading price of $3.75.
Polkadot price prediction 2029
In 2029, the Polkadot coin could reach a minimum price level of $5.16, a maximum price of $6.32, and an average trading price of $5.35.
Polkadot forecast 2030
The price of Polkadot is predicted to reach a minimum value of $7.50 in 2030. Traders can anticipate a maximum value of $8.93 while monitoring key support levels and an average trading price of $7.77.
Polkadot price prediction 2031
According to the Polkadot price prediction for 2031, $DOT could reach a maximum price of $13.13, a minimum price of $10.57, and an average forecast price of $10.96.
Polkadot price prediction 2032
In 2032, Polkadot’s price is predicted to reach a minimum level of $15.69. Should positive market sentiment persist, $DOT can attain a maximum cost of $18.44 and an average trading price of $16.24.
Polkadot market price prediction: Analysts’ $DOT price forecast
| Firm | 2026 | 2027 |
| DigitalCoinPrice | $1.32 | $1.64 |
| Coincodex | $1.16 | $2.22 |
Cryptopolitan’s Polkadot ($DOT) Price Prediction
For 2026, Polkadot is expected to trade between $1.15 and $2.01, with an average price near $1.73. Continued network growth and adoption could support gradual gains. By 2032, $DOT could reach up to $18.44.
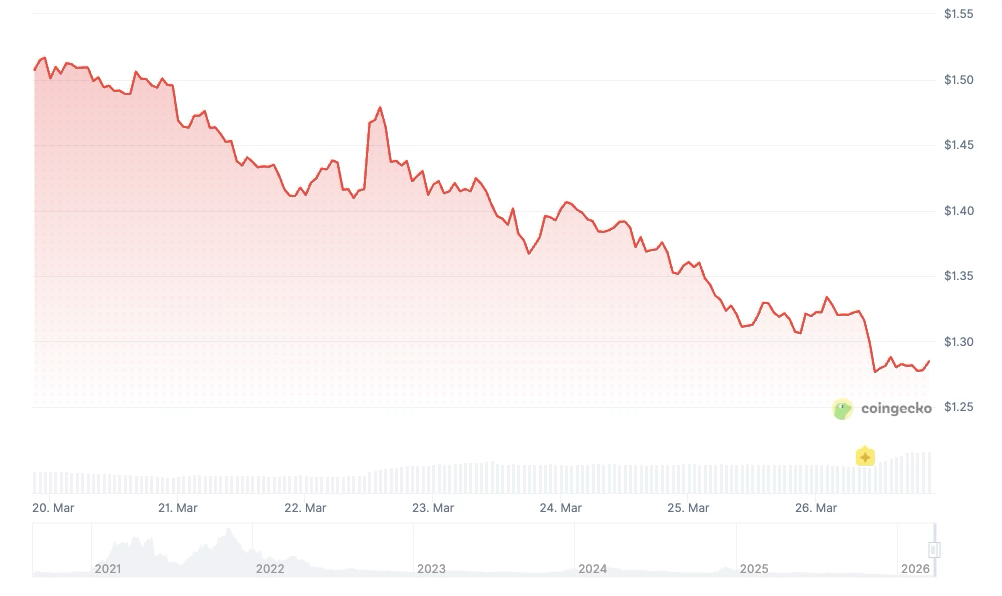
Polkadot historic price sentiment
- After spending most of the second half of 2020 trading around $4-$5, the price broke above the previous all-time high of $7 on December 29 and quickly reached the Polkadot price projection of $10.
- Polkadot experienced rapid growth, with its price climbing from around $3 in January to an all-time high of approximately $57.50 in May 2021.
- After the peak, the price declined sharply, falling to around $10 by July before partially recovering to over $40 in November 2021.
- In 2022, Polkadot price steadily declined, starting the year around $30 and dropping below $10 by mid-year.
- By the end of 2022, the price stabilized near $5 as bearish market conditions dominated the cryptocurrency space.
- The price of $DOT hovered between $5 and $7 for most of 2023, reflecting a period of consolidation and limited market excitement.
- In January 2024, Polkadot’s price remained relatively stable, trading around the $5–$6 range.
- By July 2024, Polkadot showed slight signs of recovery, with its price rising to around $7–$8. This modest uptick was likely driven by increasing market interest.
- In December 2024, Polkadot showed signs of recovery, with its price climbing to around $10.4.
- In January 2025, Polkadot peaked at $7.98 but lost momentum towards the end of the month, resulting in a trading range of $4.64 to $5.28 in February.
- In March 2025, Polkadot ($DOT) traded at approximately $4.30.
- In April 2025, Polkadot ($DOT) experienced a gradual downtrend, with its price hovering slightly below the $4 mark amid ongoing market volatility.
- In May, Polkadot ($DOT) began trading at around $ 4.10 and exhibited moderate fluctuations. As of the latest update, the price has declined slightly and is currently hovering near $ 3.90, reflecting a mild bearish trend so far.
- Polkadot ($DOT) declined from a high of around $4.20 to approximately $3.30 in June, with a consistent downtrend and brief rebounds near $3.60 in July.
- In August 2025, Polkadot traded around $4.10, maintaining a steady pace with limited volatility. The price slightly dipped during September 2025, hovering near $4.00 as market sentiment remained neutral.
- By October 2025, $DOT showed mild recovery, trading near $4.30, suggesting cautious accumulation among traders amid broader market stabilization.
- As of November 2025, Polkadot price fluctuated between $2.55 and $2.67 before stabilizing around $2.60.
- Polkadot fell from roughly $2.7 in early November to about $2.1 by the end of the month, holding near the same level in early December.
- In January 2026, Polkadot ($DOT) traded between $1.66 and $2.33, and in February, the coin traded between $1.15 and $1.74. In March, the coin trading between $1.27 and $1.34.

