


 6
6
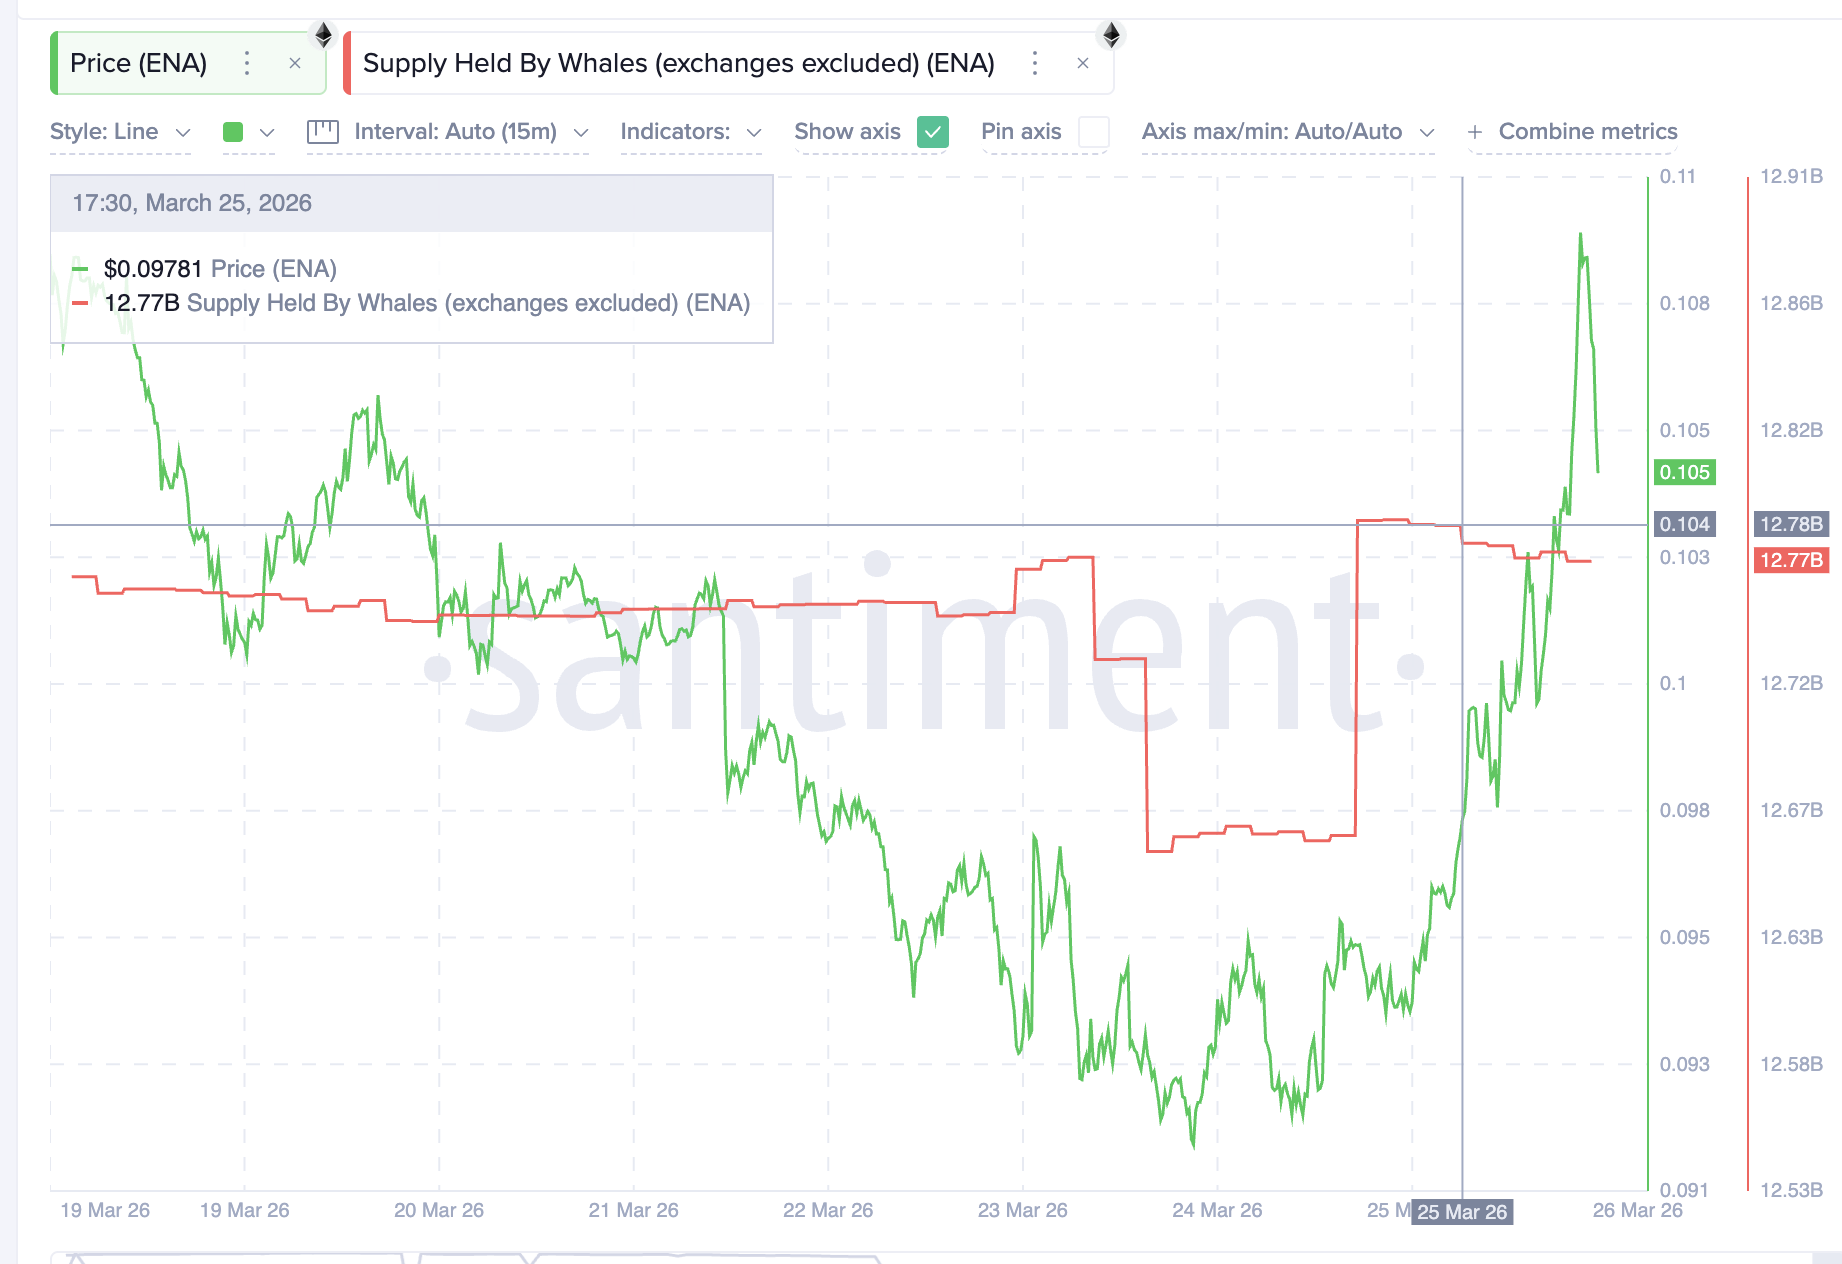
Ethena ($ENA) price surged roughly 20% since March 24, touching highs near $0.109 as whale accumulation and a new DeFi yield opportunity on Aptos drew fresh capital into the ecosystem.
However, the rally has already shown signs of exhaustion. A long upper wick on the latest 12-hour candle, declining whale balances, and a hidden bearish divergence suggest that the move may have been a profit-booking exercise rather than the start of a sustained recovery.
Whales Accumulated 120 Million, Then Started Pulling Back
Whale wallets, excluding exchange addresses, began adding $ENA aggressively on March 24. By March 26, that balance had climbed to 12.78 billion, an addition of roughly 120 million $ENA in just three days.
The timing aligns with a catalyst. A new sUSDe-$USDC liquidity pool on Aptos, launched via Hyperion, attracted over $11 million in total value locked within its first 24 hours. The pool offered a 59.2% APY with a 30x Sats multiplier, turning staked $USDe into a high-yield DeFi primitive.
That demand for sUSDe flows directly back to the Ethena price, as users must mint or acquire $USDe and stake it to participate.
Hyperion is now live on the first page of @ethena opportunities.
— Hyperion (@hyperion_xyz) March 25, 2026
sUSDe-$USDC pool:
– 59.2% APY
– $11.32M TVL
– 30x Sats multiplier
Click to deposit directly from Ethena's interface.
Deploy capital → https://t.co/3IGtGsDpX6 pic.twitter.com/muXBuRSEBv
However, the accumulation appears to have peaked. Since reaching 12.78 billion, whale balances have begun declining, dropping to 12.77 billion.
 $ENA Whale Supply">
On the 12-hour chart, the latest candle carries a prominent upper wick, meaning the price was rejected sharply after touching highs. When whale holdings peak and pull back at the same time as a wick rejection forms, it typically confirms that large holders used the rally to book profits.
This is not unusual for a token that has remained down roughly 50% over the past three months. Whales entering on a DeFi-driven pump and exiting near resistance is a classic short-term rotation. The question is whether the remaining buyers can hold the line.
The 12-hour Relative Strength Index (RSI), a momentum signal, suggests they may struggle. Between February 26 and March 26, the Ethena price seems to be forming a lower high while the RSI is close to confirming a higher high. That hidden bearish divergence points to a continuation of the broader downtrend.
The structure confirms if the next 12-hour candle closes below $0.109. It only invalidates above $0.119, the previous swing high.
Long Leverage Tilts the Risk Lower
The Bybit $ENA/USDT perpetual liquidation map over the past seven days (active positions) reveals a heavily long-biased market. Cumulative long liquidation leverage stands at $7.51 million against just $3.12 million in shorts. The rally attracted leveraged buyers, and if the price reverses, those positions become fuel for a downside cascade.
Want more token insights like this? Sign up for Editor Harsh Notariya’s Daily Crypto Newsletter here.
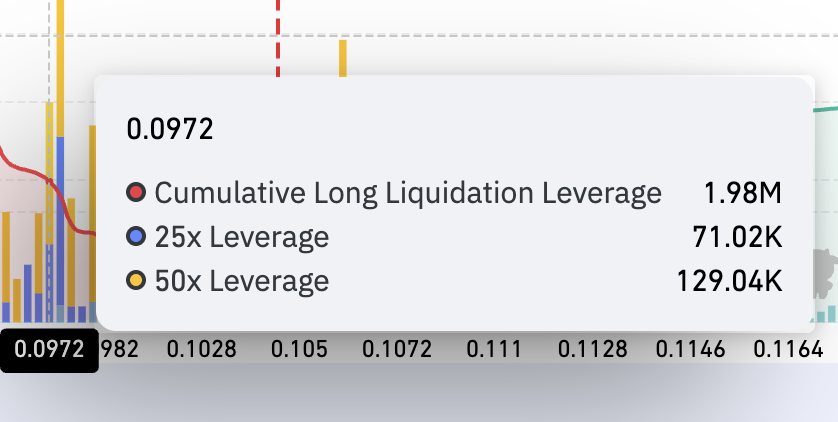
One of the densest near-term long liquidation clusters sits near $0.097, where roughly $2 million in positions would get triggered. A move into those zones would quickly liquidate overleveraged longs.
With whales already trimming, divergence forming, and leverage tilted long, the derivatives market aligns with on-chain data, pointing toward near-term caution.
Ethena Price Forecast and the $0.106 Test
The 12-hour chart shows that $0.106 has acted as a strong resistance. This level rejected the Ethena price on March 20 and again on the current candle. A 12-hour close above that level is the minimum requirement for the rally to continue. A move above $0.120 would confirm strength and invalidate the hidden bearish divergence flashing on the chart.
On the downside, $0.102 is the first line of defense. That level aligns with where the majority of long liquidations begin to cluster on the 7-day map. A break below $0.102 would likely trigger a chain reaction through $0.097. This is where a $2 million liquidation pocket sits, and potentially down to $0.091.
For now, $0.106 separates a continuation of the DeFi-driven bounce from a liquidation-fueled pullback to $0.091.
The post Ethena Price Up 20% on sUSDe Yield Frenzy, but Whales Could be Booking Profits appeared first on BeInCrypto.
