

 3
3
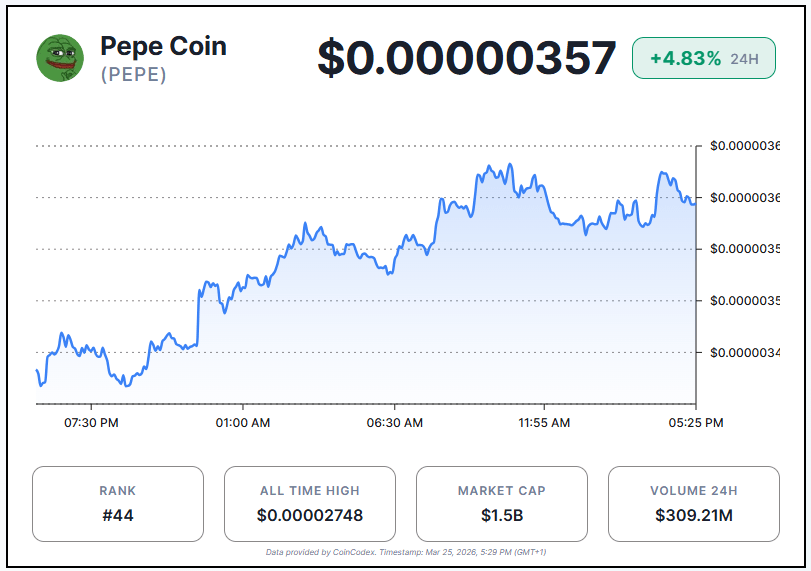
Pepe shows a steady intraday recovery after briefly dipping near $0.00000341 earlier in the session. Buyers quickly regained control, pushing price toward $0.00000357 with consistent higher highs and shallow pullbacks. The upward structure suggests strengthening short-term momentum as demand gradually outweighs selling pressure. Volume remains relatively stable, supporting the gradual climb and indicating continued interest near the current range.
At the time of writing, $PEPE is trading at $0.00000357, up by 4.83% for the past 24 hours.
$PEPE Breakout and Retest Signals Short-Term Upside
$PEPE is trading near $0.00000356 after breaking above a descending trendline that controlled price since early 2026. The breakout confirms a shift in short-term momentum. Price briefly retested the breakout zone around $0.00000350–$0.00000355 and held support. This successful retest suggests buyers are defending the level. According to analyst Crypto Candy, the structure now supports a potential 10–20% short-term move.
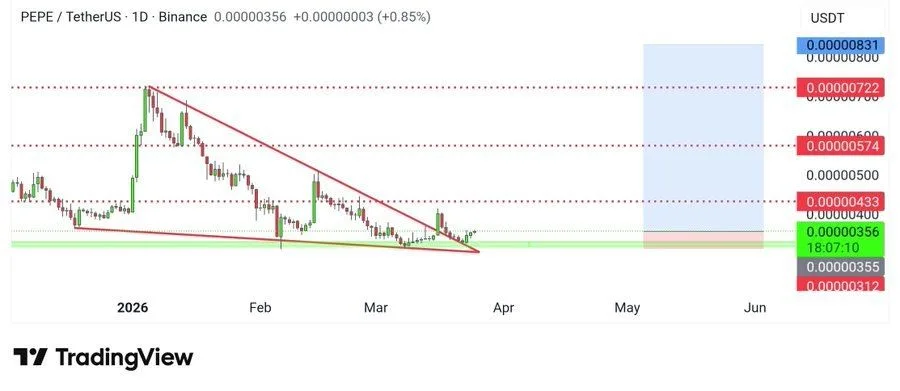
If momentum continues, the first upside target sits near $0.00000433, which acts as the nearest resistance. A break above that level could push the price toward $0.00000574. Strong support remains near $0.00000312, limiting downside risk in the short term. Holding above $0.00000350 keeps the bullish breakout structure intact and increases the probability of a continuation move.
$PEPE Consolidates Near Key Support as Momentum Gradually Improves
Looking at the 1-day Pepe price chart, the token shows a broader bearish structure, but recently moved into sideways consolidation. Price trades near $0.00000354 after repeated rejections from higher levels. Support around $0.00000340 continues holding, with slowing selling pressure. The tightening price action suggests the market is stabilizing near a key demand zone.
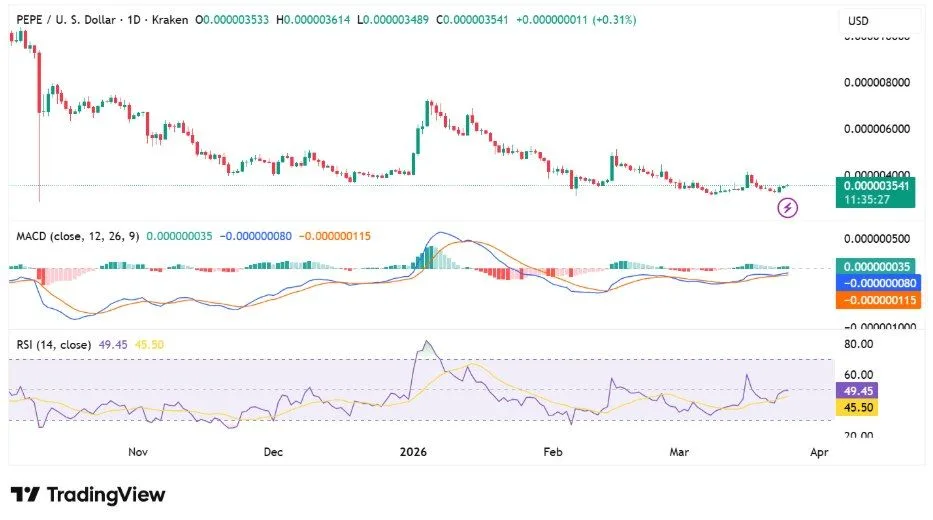
The MACD indicator shows fading bearish momentum as the histogram approaches the neutral line. MACD lines are converging near zero, hinting at a possible bullish crossover. Meanwhile, RSI sits near 49 while its signal line stays around 45. This positioning reflects neutral momentum with slightly increasing buying pressure.