

 2
2
Cardano held a historic support zone as buyers attempted to stabilize price action, though broader momentum remained cautious overall today.
The Cardano ($ADA) market may be showing early signs of life after an intraday rebound pushed $ADA back above a key short-term level. The crypto traded around $0.2623 at the time of the chart capture, up 5.2% over 24 hours, after climbing from a daily low near $0.2483.
The move stands out because $ADA did not grind higher gradually. Instead, it posted a sharp vertical jump to $0.2659, which signaled a sudden return of buying pressure.
After that breakout, the price moved into a tighter consolidation range between roughly $0.259 and $0.265. That structure suggests buyers managed to defend most of the rally, rather than giving back gains immediately.
What’s Next for Cardano
Cardano is trying to stabilize, but its indicators still show a market that has not fully shaken off bearish pressure. On the daily chart, $ADA trades near $0.2630, just below the 20-day Bollinger Band midline at $0.2647.
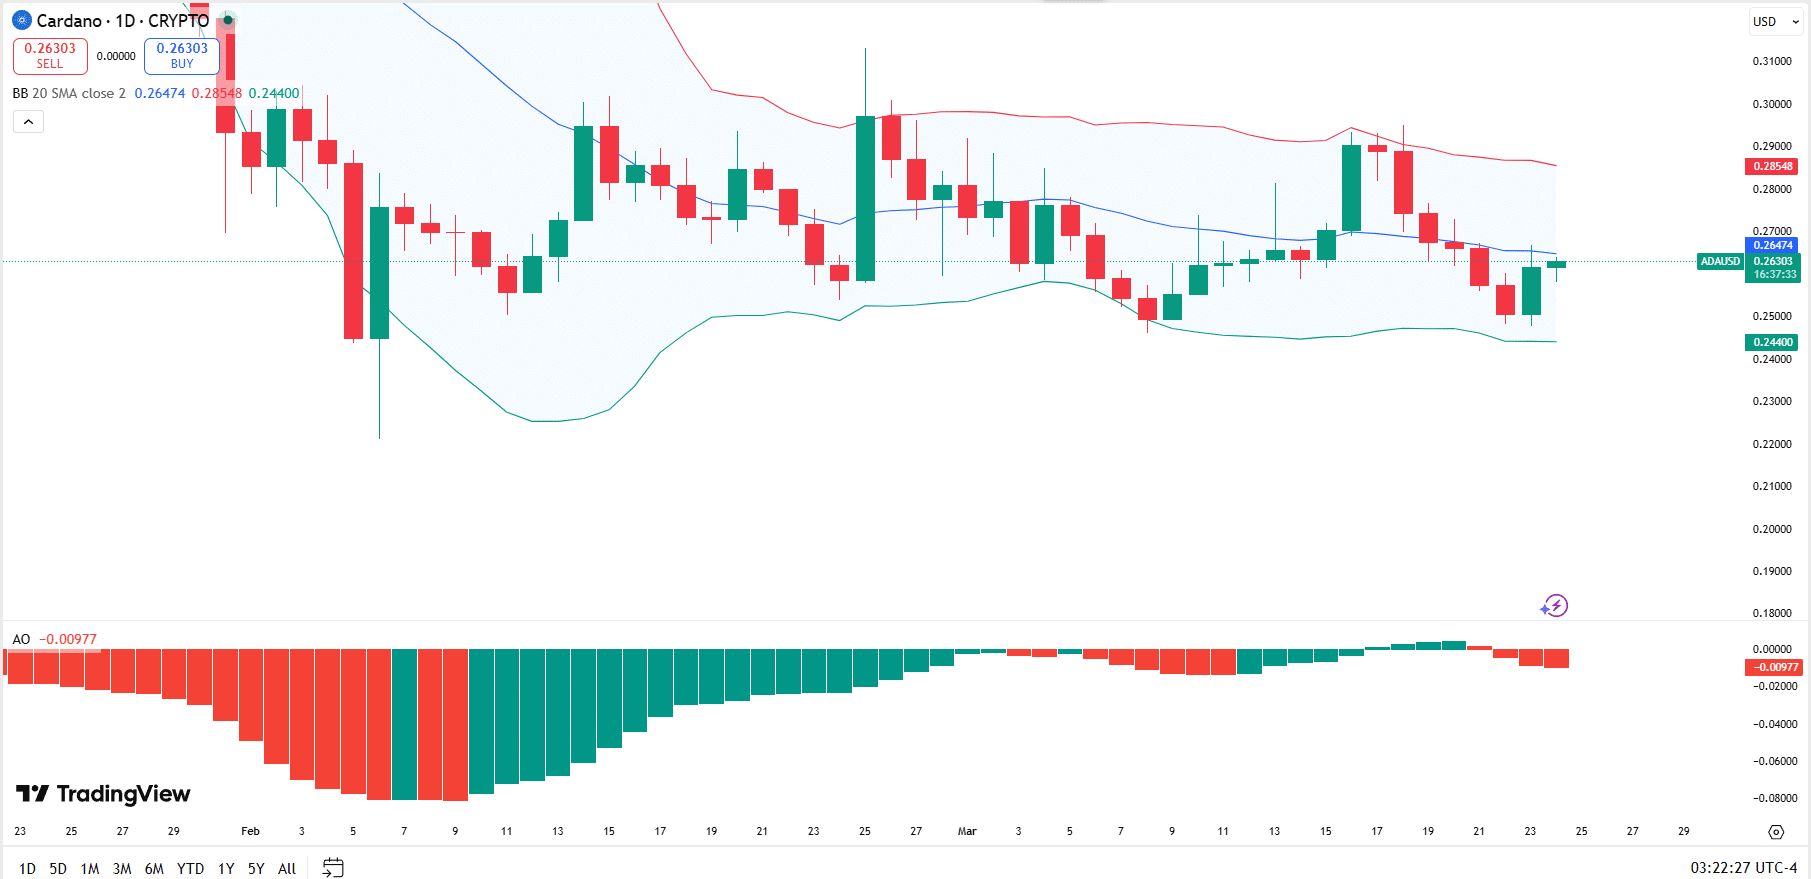
That level matters because it is now acting as a short-term trend gauge. Cardano has rebounded from the lower part of the range, yet it still has not produced a strong breakout above the middle band.
This shows buyers are improving their position but have not taken full control. The Bollinger Bands show the upper band near $0.2855 and the lower band near $0.2440.
The Awesome Oscillator adds to that mixed picture. The indicator remains below the zero line at around -0.00977, which means momentum remained negative overall. More importantly, the histogram has started turning red again after a brief improvement, showing that bullish momentum is fading before it can fully reverse the trend.
From a market structure view, $0.2440 remains the key downside support from the Bollinger lower band, while $0.2647 is the first resistance to watch. Above that, $0.2855 stands out as the next major upside barrier.
Cardano at a Historic Level
Elsewhere, Cardano is back near a level that previously triggered strong rebounds, according to crypto analyst Ali Martinez. He mentions that $ADA’s last two visits to the $0.25 zone led to rallies of 85% and 200%.

Martinez’s weekly chart shows $ADA trading around $0.259, with a nearby support marker at roughly $0.249. That places the token close to a historical demand area that held during earlier corrections before sharp upside moves followed.
A break below that level would weaken the bullish comparison and raise the risk of a deeper decline. On the upside, the next major resistance on the chart sits near $0.547.
That level marks the first big barrier if $ADA starts to rebound from current prices. If bulls clear that area, the next broader level on the weekly structure appears near $1.195.
