

 3
3
$XRP is getting closer to a technically crucial area, where a number of support factors are coming together, which could be a turning point in price movement.
The 26 EMA, the 50 EMA and a distinct ascending trendline have all aligned at almost the same level on the daily chart, creating a dense support cluster that traders are paying close attention to. Although it is uncommon, this kind of confluence frequently serves as a market decision point.
$XRP's short-term momentum
While the 50 EMA shows a more general intermediate trend, the 26 EMA, which usually indicates short-term momentum, has been directing recent price movements. It appears that volatility is tightening and the market is getting ready for a directional move because both moving averages are compressing into the same area.
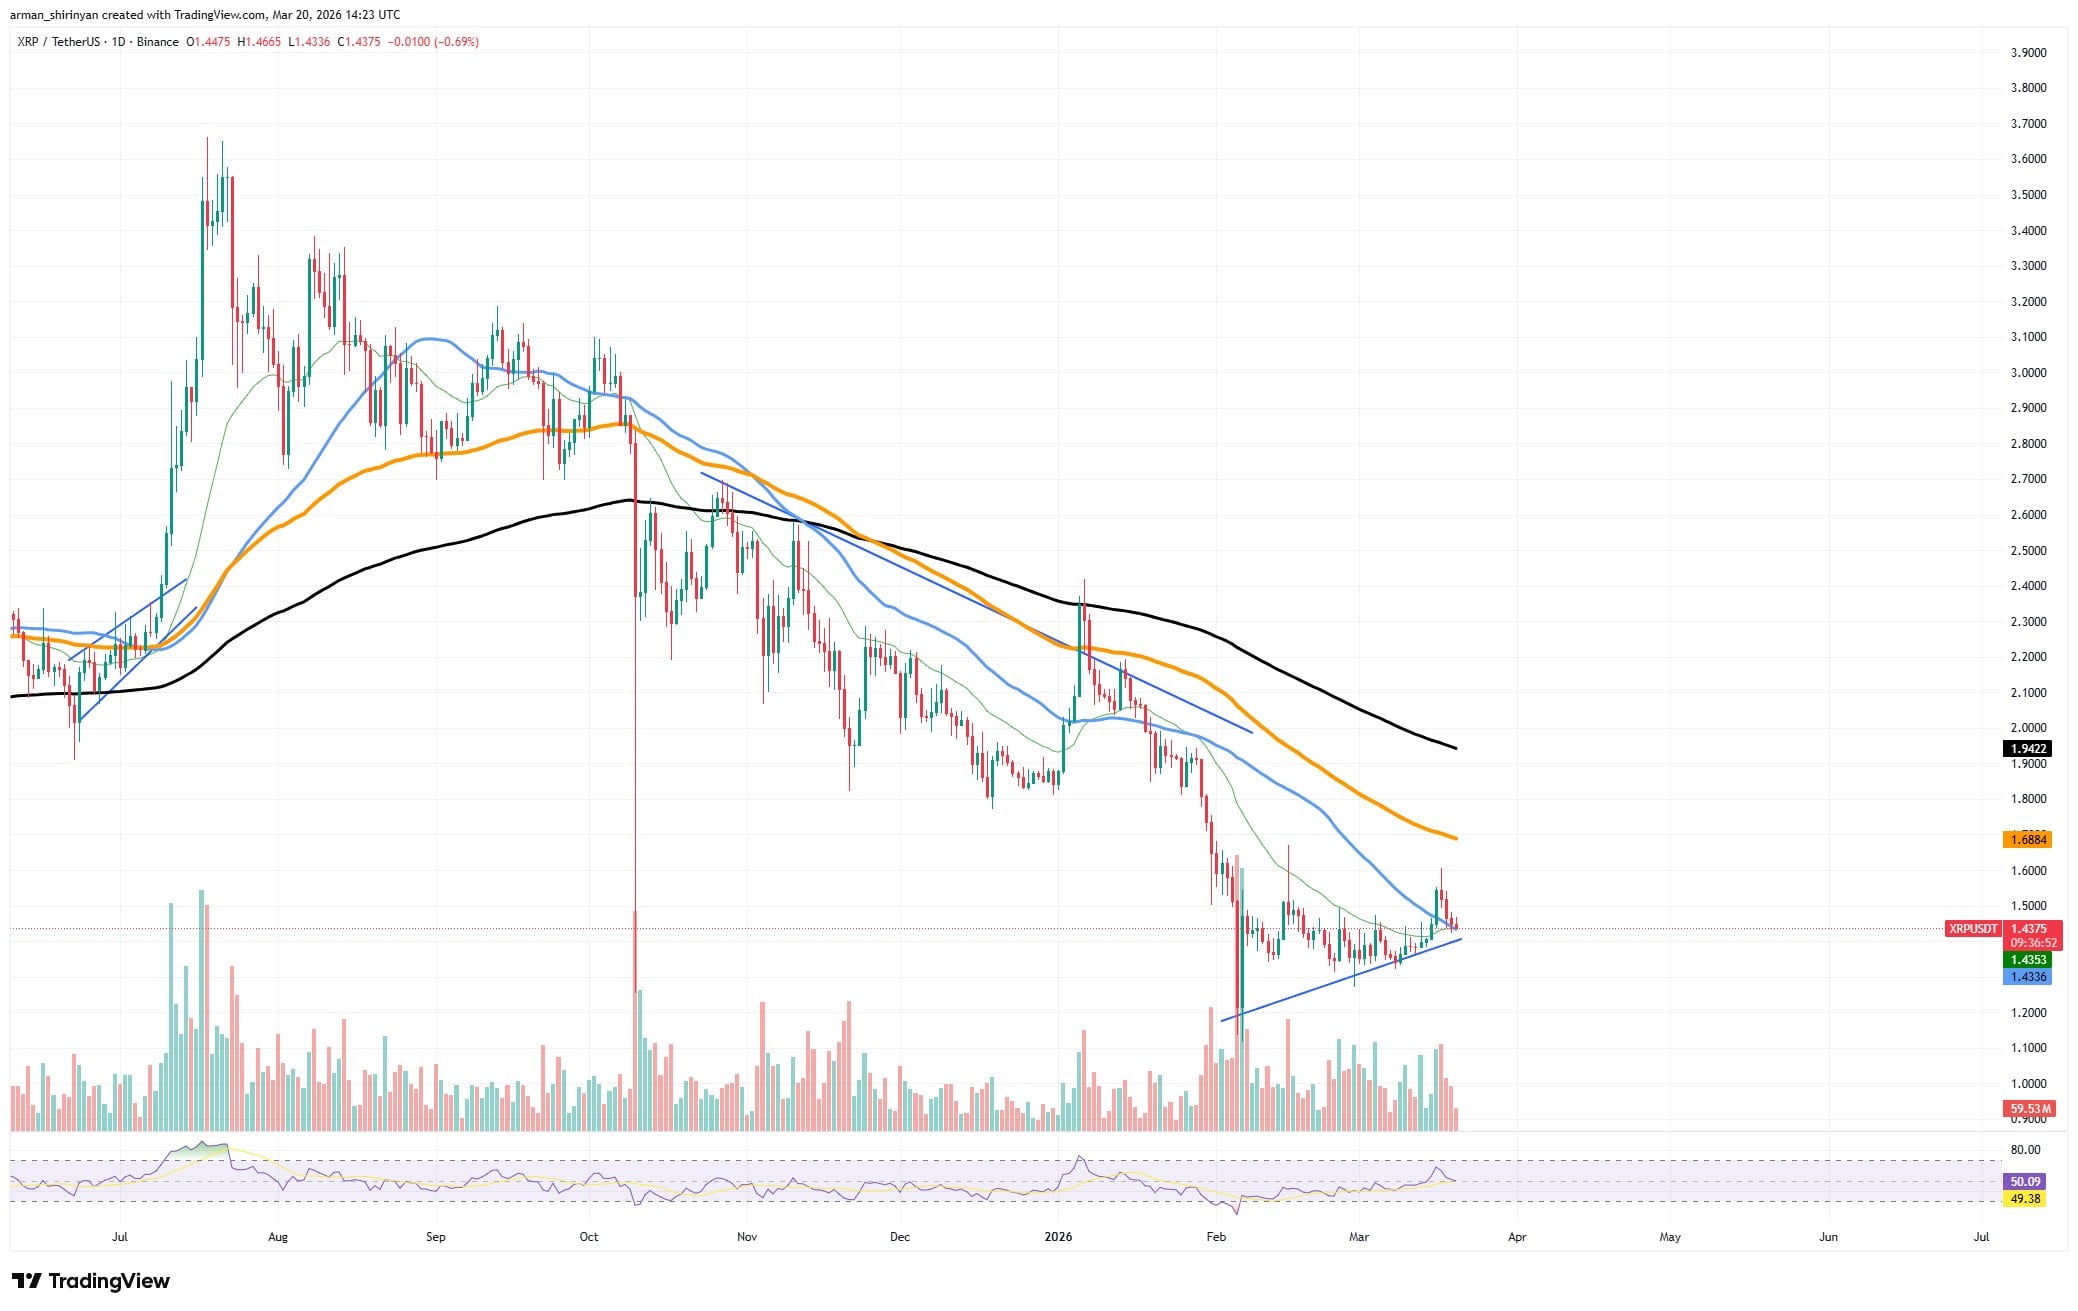
The rising trendline that has been developing since $XRP's local bottom complements this configuration. This trendline has already been upheld several times, indicating that buyers are entering the market at increasingly higher levels. The strength of this support zone is further strengthened by its intersection with both EMAs.
$XRP's recent price behavior indicates that it is retreating into this confluence after failing to maintain a breakout above surrounding resistance. But rather than being impulsive, the pullback itself seems controlled, which is usually an indication of consolidation rather than distribution.
Further evidence that sellers are not in complete control comes from the fact that volume has not sharply increased on the downside. Such a configuration tends to favor a bounce scenario from a probabilistic perspective. When several technical indicators group together, both algorithmic systems and discretionary traders recognize the same level, which tends to draw liquidity and buying interest.
In the short term, a return to the $1.50-$1.60 resistance range is conceivable if $XRP maintains this zone. However, the opposite is also crucial. Because the loss of three concurrent supports would eliminate a crucial defensive layer for bulls, a breakdown below this confluence would invalidate the structure and probably cause a sharper move downward.
Shiba Inu ready for more
The price of Shiba Inu is nearing a pivotal technical moment, as it continues to struggle below a crucial resistance level indicated by the 50-day exponential moving average (EMA).
The asset has made several attempts at recovery in recent sessions, but each increase has been limited, highlighting sellers' dominance in the current structure. Upward momentum is continuously rejected by the 50 EMA, which functions as a dynamic ceiling.
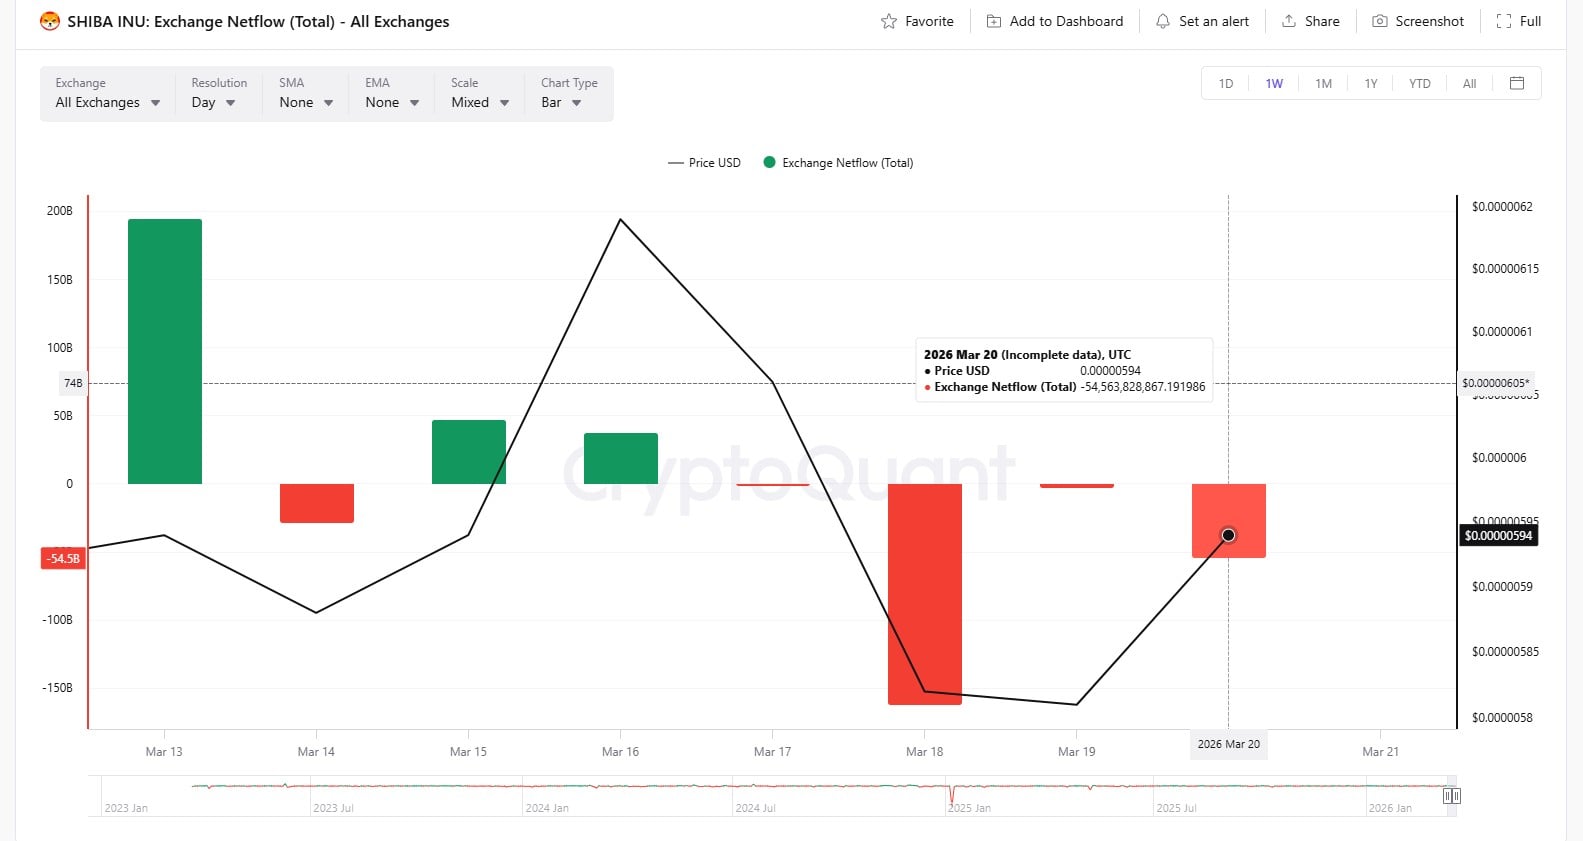
A sequence of lower highs in price action suggests that bullish attempts have not been sustained. Even brief increases are swiftly absorbed, indicating that market players are taking advantage of strength as a chance to sell rather than buy. Rather than trend reversals, this behavior is usually linked to bearish continuation phases.
The structure of $SHIB is still weak, in addition to the moving average resistance. Buying pressure is insufficient to change momentum, as evidenced by the emergence of declining patterns and unsuccessful breakout attempts. Although there has been some stabilization in the vicinity of local lows, it seems more like a pause than a reversal.
Since there is no significant expansion to go along with upward movements, volume does not support a compelling recovery narrative either.
This failure to recover the 50 EMA is a crucial indication. This level frequently acts as a boundary between short-term bullish and bearish control on trending markets. Staying below it maintains $SHIB's downward bias. Any upward movement is likely to be corrective unless the price can firmly break above and hold that level.
From a wider angle, this arrangement suggests that bears are still in complete control. A reversal would normally be preceded by accumulation or aggressive dip buying, neither of which are evident in the market. Rather, it is displaying traits of a continuation pattern in which every rally gives way to resistance.
Ethereum's bearish short-term outlook
Recent price action indicates that Ethereum's short-term recovery may be coming to an end, and the cryptocurrency is getting close to a critical threshold.
$ETH was able to stage a slight increase after recovering from recent lows close to the $2,000 area. But the recovery structure raises questions about its long-term viability, especially given the weakening volume trends.
The consistent drop in trading volume during the most recent price increase is one of the more telling indicators. Expanding volume usually supports rising prices during healthy bullish reversals, indicating high buyer participation. The opposite is happening with Ethereum. The fact that the upward movement is occurring on declining volume suggests that the rally lacks conviction and may be more motivated by short-term positioning than by real demand.
Ethereum's main barrier
Technically speaking, Ethereum is still below important moving averages such as the 50 EMA, which continues to serve as overhead resistance. $ETH has not been able to establish a stronger trend reversal because selling pressure has been applied to every attempt to push higher. With lower highs and little follow-through on bullish candles, the overall structure still shows a downward trend.
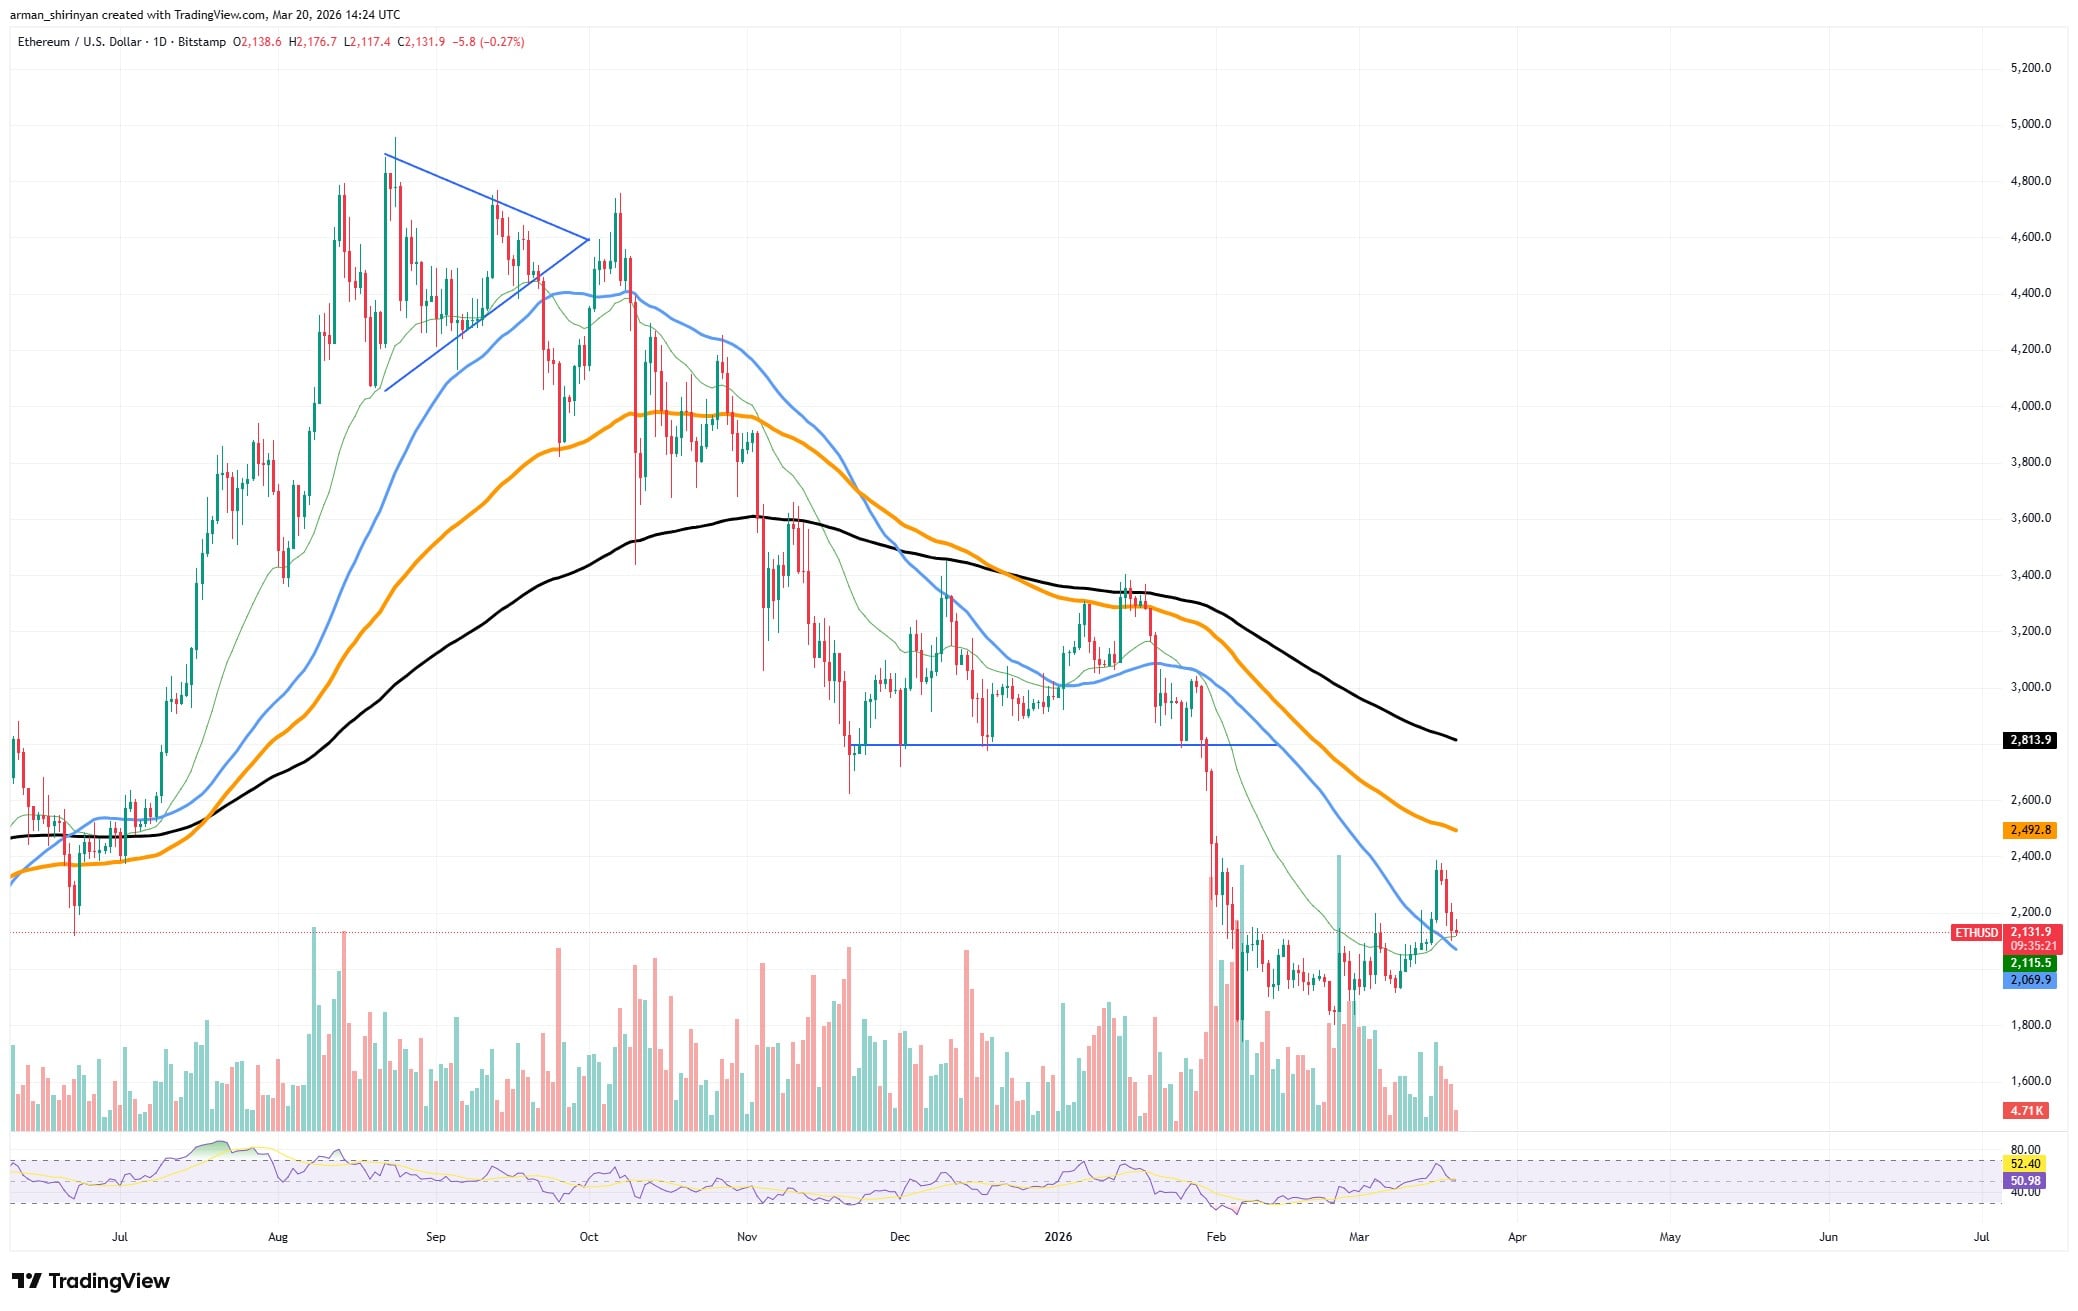
Additionally, it seems that the recent bounce was corrective rather than impulsive. Without the momentum usually associated with a trend shift, the price is rising within a limited range. This kind of behavior frequently occurs before another leg descends, particularly when it is paired with decreasing resistance and volume overhead.
The possibility of a breakdown rises if Ethereum is unable to recover and maintain above adjacent resistance levels. Currently, the $2,000 mark serves as a technical and psychological support zone. A loss of this level would indicate that buyers are unable to defend a crucial area that served as a foundation for recovery, which could lead to further declines.
The market seems vulnerable in the short term. The current upward trend appears to be short lived at best, leaving room for a retest below $2,000 in the upcoming week unless volume recovers and Ethereum can successfully break above its resistance levels.