


 2
2
Cardano attempts a recovery as price approaches resistance, while an analyst identifies key support and resistance zones that could define the next move.
Notably, Cardano ($ADA) has found support and worked its way back to around $0.2705, posting a 24-hour gain of 1.08%. The intraday chart shows $ADA falling toward the $0.263 region before demand returned and lifted the price back above $0.273.
Gains on the four-hour and seven-day views add to that recovery signal, even as the wider monthly trend remains weak. That mix leaves Cardano in a short-term rebound phase rather than a full reversal.
Meanwhile, buyers are regaining some control near the daily highs. Also, $ADA now sits at a point where fresh momentum could either strengthen the recovery or fade into another test of support. What’s next for $ADA?
Cardano Price Analysis
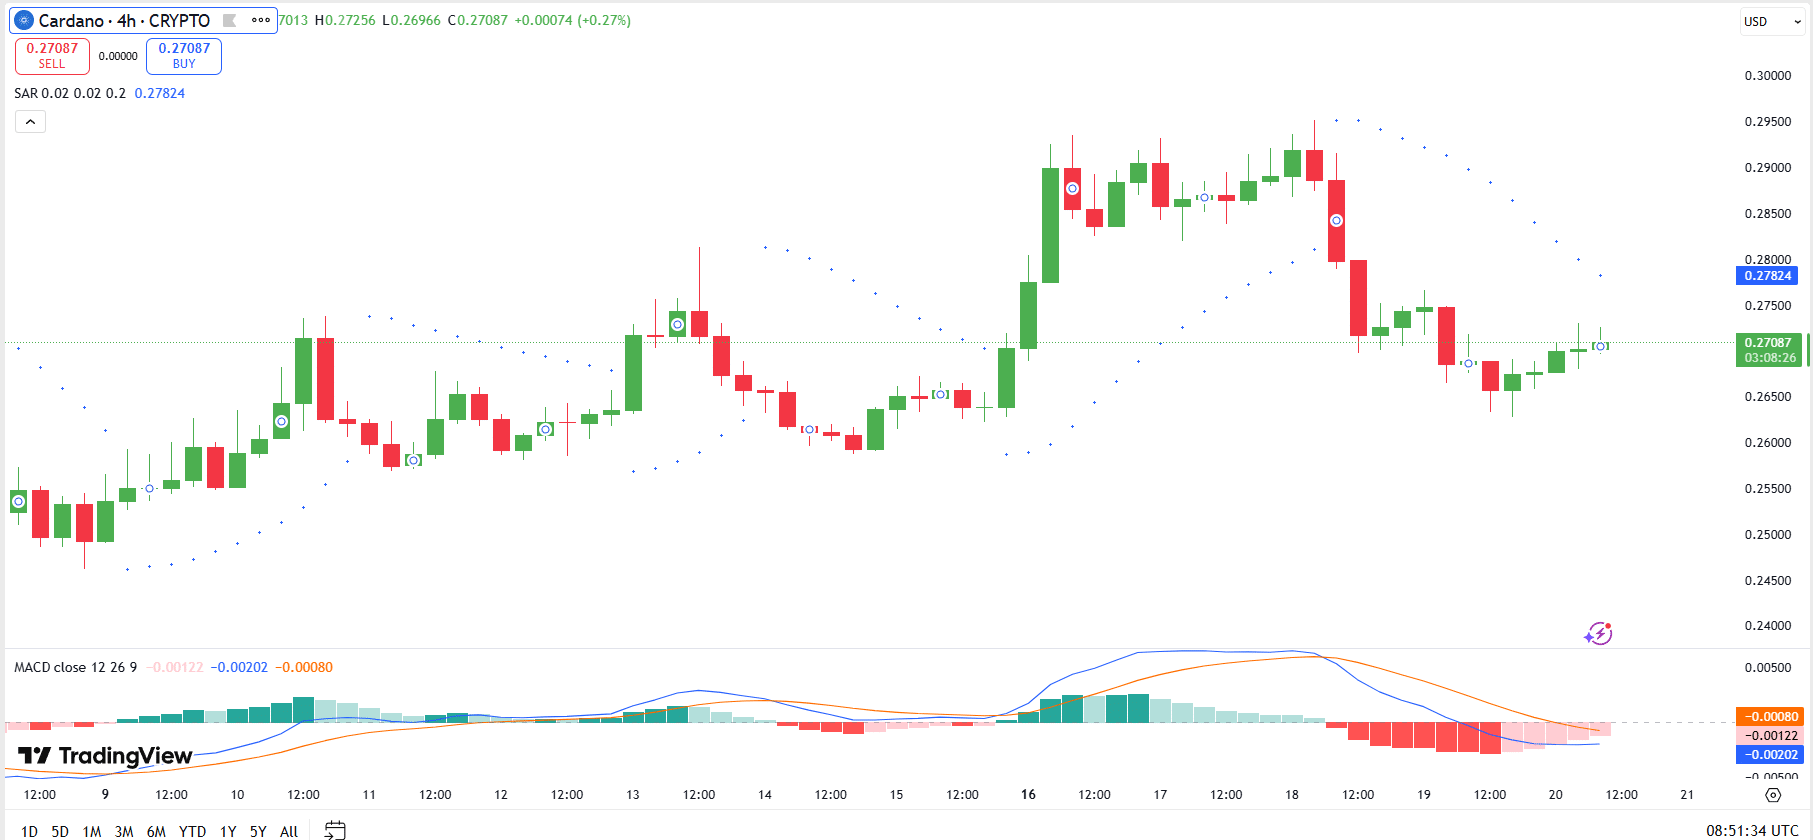
Cardano’s four-hour chart shows the price trying to gain ground after the pullback from the recent high near $0.295. The latest candles point to a modest recovery from the $0.263 area, which suggests buyers are attempting to rebuild short-term support.
Even so, $ADA remains below the recent swing high, so the rebound still looks corrective rather than a confirmed breakout.
The Parabolic SAR now sits above the price near $0.2782, which keeps the short-term signal tilted to the downside. As long as $ADA stays below that level, sellers still have the upper hand in the current structure. A move above the SAR zone would be necessary to weaken that bearish pressure and improve the case for a stronger upside recovery.
The MACD remains in negative territory, with the MACD line near -0.00202 and the signal line near -0.00122. The histogram is also still below zero, which shows bearish momentum remains in place.
However, the bars are starting to shrink. This may indicate that selling pressure is easing and that downside momentum is losing strength.
Cardano Prints Buy Signal
Interestingly, analyst Ali Martinez said Cardano has printed a buy signal on the weekly chart. The TD Sequential indicator is flashing a “9,” which suggests the recent downtrend may be losing strength.
He noted that this setup often points to a potential rebound lasting one to four weeks.

According to the analyst, $ADA needs to hold the $0.23 support level on a weekly close to confirm the signal. If this level holds, he identifies $0.32 and $0.37 as the next upside targets, but a breakdown below $0.23 would invalidate the bullish setup.


