


 11
11
$XRP has faced rejection at a key Fibonacci level on the weekly timeframe, with analysis suggesting further price downturns could follow.
Notably, this rejection is evident in the long $XRP wick, signaling that the price trended higher at some point this week before bears regained control. Meanwhile, analysis highlights that there is more to the level from which the asset dropped.
Key Points
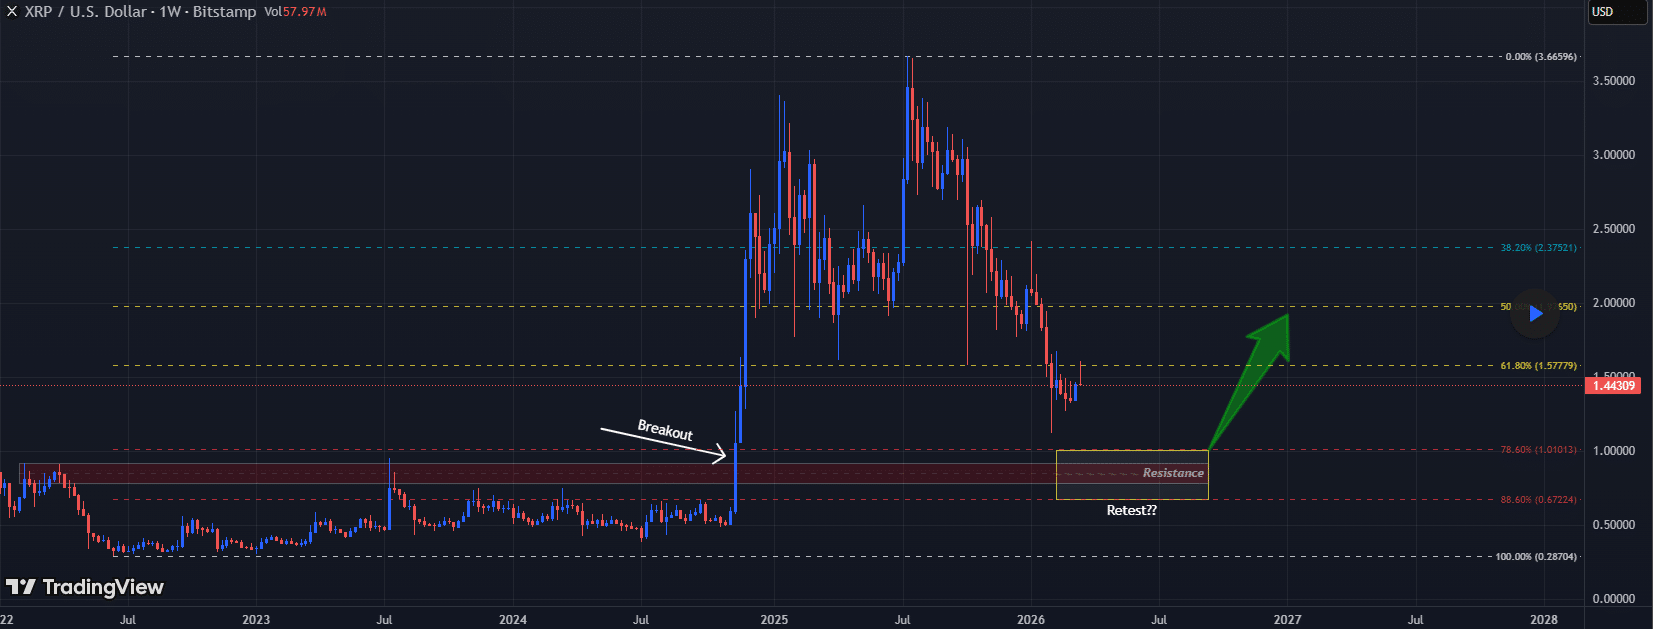
- $XRP faced severe selling pressure and a consequent pullback at $1.60 earlier in the week, closely aligning with the 0.618 Fibonacci retracement level.
- The downtrend may persist, with the Fibonacci tool identifying $1.01 and $0.67 as the two possible price levels to which $XRP could drop.
- These levels hold historical importance for the $XRP price, as they were a notable resistance area that the coin failed to break above from 2022 until November 2024.
- From this area, $XRP could possibly recover to the 0.50 Fibonacci level at $1.97, representing a 36% rise from here.
- The recent regulatory clarity around its classification has fueled the conviction that $XRP would rebound higher after the support retest
$XRP Drops from 0.618 Fibonacci Level
Analyst “Novi Fionacci” highlighted in his recent TradingView outlook that the point where $XRP faced severe selling pressure and a consequent pullback closely aligned with the 0.618 Fibonacci retracement level.
For context, the prominent altcoin reached an intra-week high of $1.60, spurred by a broader market rebound. However, this upward momentum has faded, with $XRP dropping 10% to its current price of $1.44.
The analyst highlighted that close to this weekly high is the 0.618 Fib. level at $1.57. He disclosed that he employed the Fibonacci tool from $XRP’s lows at 0.28 to its ATH at $3.66 to arrive at these levels.
Further $XRP Corrections to Ensue?
The rejection has been brutal, and the market watcher notes there could be further price weakness. With the Fibonacci tool, he identified two possible price levels to which $XRP could drop if his expectations play out.
Specifically, the analyst highlighted the 78.6% and 88.6% Fibonacci levels as strong demand zones where prices could find support. An accompanying chart shows this aligns with the $1.01 and $0.67 price marks, respectively.
From the current market price of $0.44, $XRP would have to fall 30% and 53% to reach these price levels.
Levels Hold Historical Value
Further, the analyst noted that the 0.786 and 0.886 Fib. levels hold historical importance to the $XRP price. Specifically, this range was a notable resistance area, with the coin failing to break above from 2022 up until November 2024. Uptrends into this zone faced a sharp rejection, reinforcing the zone’s heavy selling pressure.
However, November 2024 marked a turning point, with $XRP breaking out during the Donald Trump-inspired rally, turning the resistance into support. Since then, $XRP has not retested these areas.
Now, the analysis suggests that a drop into this zone could follow $XRP’s recent rejection at higher levels. He noted that this could be the area where buyers step in again and build momentum for a higher rebound.
From this area, the chart shows a possible recovery to the 0.50 Fibonacci level at $1.97, representing a 36% rise from here and 95% from the 78.6% Fibonacci support.
Regulatory Boost for $XRP
Fueling the conviction that $XRP would rebound higher after the support retest is the recent regulatory clarity around its classification. A joint statement from the US Securities and Exchange Commission (SEC) and the Commodity Futures Trading Commission (CFTC) classified 16 cryptocurrencies, including $XRP, as digital commodities on March 17.
The placement moves away from the Howey Test era, positioning $XRP as a core asset in the industry. Notably, it shares this podium with Bitcoin, Ethereum, Cardano, and a handful of others.

