


 4
4
Shiba Inu could target at least a 50% rally next if it can break above a key resistance neckline trendline on the daily timeframe.
Analysis shows that breaking out of this trendline is crucial for Shiba Inu ($SHIB), as it represents a turnaround after earlier failed attempts. Furthermore, the resistance serves as a major barrier hindering the prominent meme coin from revisiting higher prices.
Key Points
- $SHIB broke cleanly above a “counter trendline” on March 13, after a push to an intraday high of $0.00000630, signaling bullish momentum is on its side.
- With this initial barrier cleared, Shiba Inu can advance toward the next major resistance level around $0.0000070, which aligns with a longer trendline on the daily chart.
- If this does happen, Shiba Inu could rally by at least 50% from that point, potentially reclaiming the $0.000010 psychological level.
- On the weekly timeframe, $SHIB is showing strength around the lower boundary of a falling wedge.
Shiba Inu Breaks First Barrier
World of Charts, a top market analyst, highlighted this Shiba Inu price trend in his recent X post. According to the commentator, $SHIB just broke cleanly above what he described as a “counter trendline,” signaling bullish momentum is on its side.
A shared chart shows this happened on March 13, following a push to an intraday high of $0.00000630. Notably, this downward-facing line had suppressed $SHIB’s price since the January 5 high of $0.00001009, before last week’s breakout.
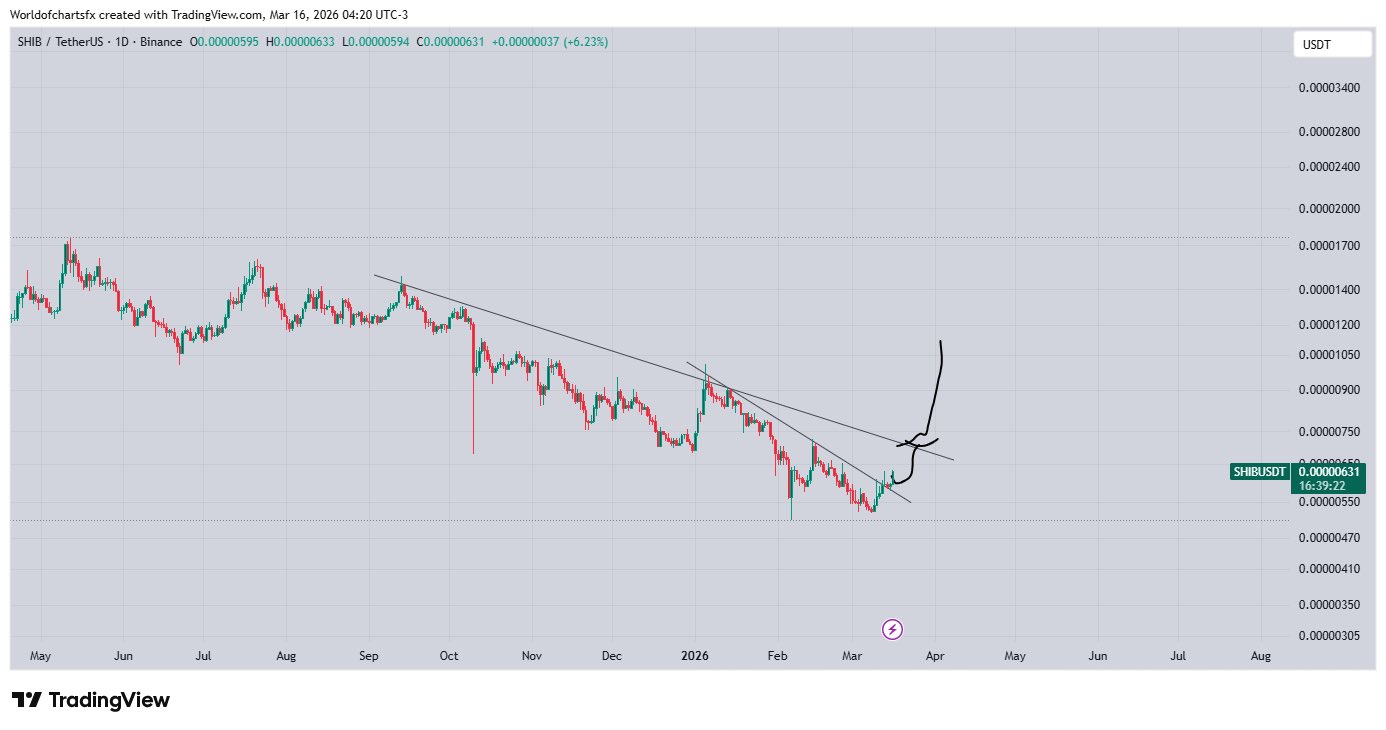
Following the breach, the token appeared to retest the resistance, dipping to $0.00000578 on Sunday before rebounding to higher prices. The breakout momentum has sparked further upside, with the meme coin rising to $0.00000644 on Monday before stalling around the area.
With this initial barrier cleared, the analyst now expects Shiba Inu to advance toward the next major resistance level.
Major Resistance as Next Target
Specifically, this resistance aligns with a longer trendline on the daily chart, which first formed around the September 13 high of $0.00001484. After facing resistance near this peak, $SHIB retraced and closed at $0.00001428.
The resistance line formed from that price point and has since kept recovery attempts by the token at bay. For context, an upsurge to $0.00001009 in January halted at this neckline resistance, with bears taking over from there.
After defying the immediate “counter trendline,” the next target is now showing similar strength at this major resistance zone, around $0.0000070. If this does happen, the analyst expects a significant price impact.
Specifically, he believes Shiba Inu could rally at least 50% from the breakout point to higher prices. From around $0.0000070, a 50% rally would take $SHIB past the psychological $0.000010 level.
Shiba Inu Price On the Weekly Chart
Meanwhile, a separate analysis by Leeron Shim offered a different perspective on the $SHIB price through the lens of the weekly chart. On this timeframe, the token is showing strength around the lower boundary of a falling wedge.
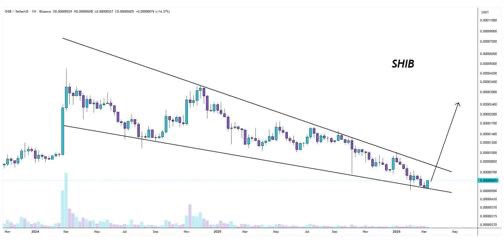
This development followed bullish price action last week, during which Shiba Inu recorded its first green candlestick on the timeframe since early January. The 12.3% bounce saw it find support around the structure’s lower support line, with bulls stepping in aggressively to defend this zone.
Nonetheless, the market watcher believes the price trajectory in the next two weeks will confirm this. If it keeps holding above this support by then, a fresh wave of bullish price action could ensue, marking the start of a full-blown market recovery.
